Volumetric MRI Report for Neurologists
I created the first iteration of an MRI report that added lesion volume tracking to traditional lesion counting, a new capability that needed validation with neurologists. With only 6 weeks until a critical neurologist conference, I designed and executed a rapid research study to understand how it would fit into clinical workflows and inform treatment decisions.
Project
0-to-1
Role
Founding Designer
Timeline
2021 - 6 weeks
Scope
Product Design
User Research
THE ASK
Design an MRI report that includes volumetric lesion measurement for neurologists and validate whether this emerging technology could be clinically useful (in 6 weeks).
BUSINESS CONTEXT
Octave Bioscience is a healthcare startup improving Multiple Sclerosis (MS) patient outcomes by shifting from trial and error treatment to objective, data driven care.
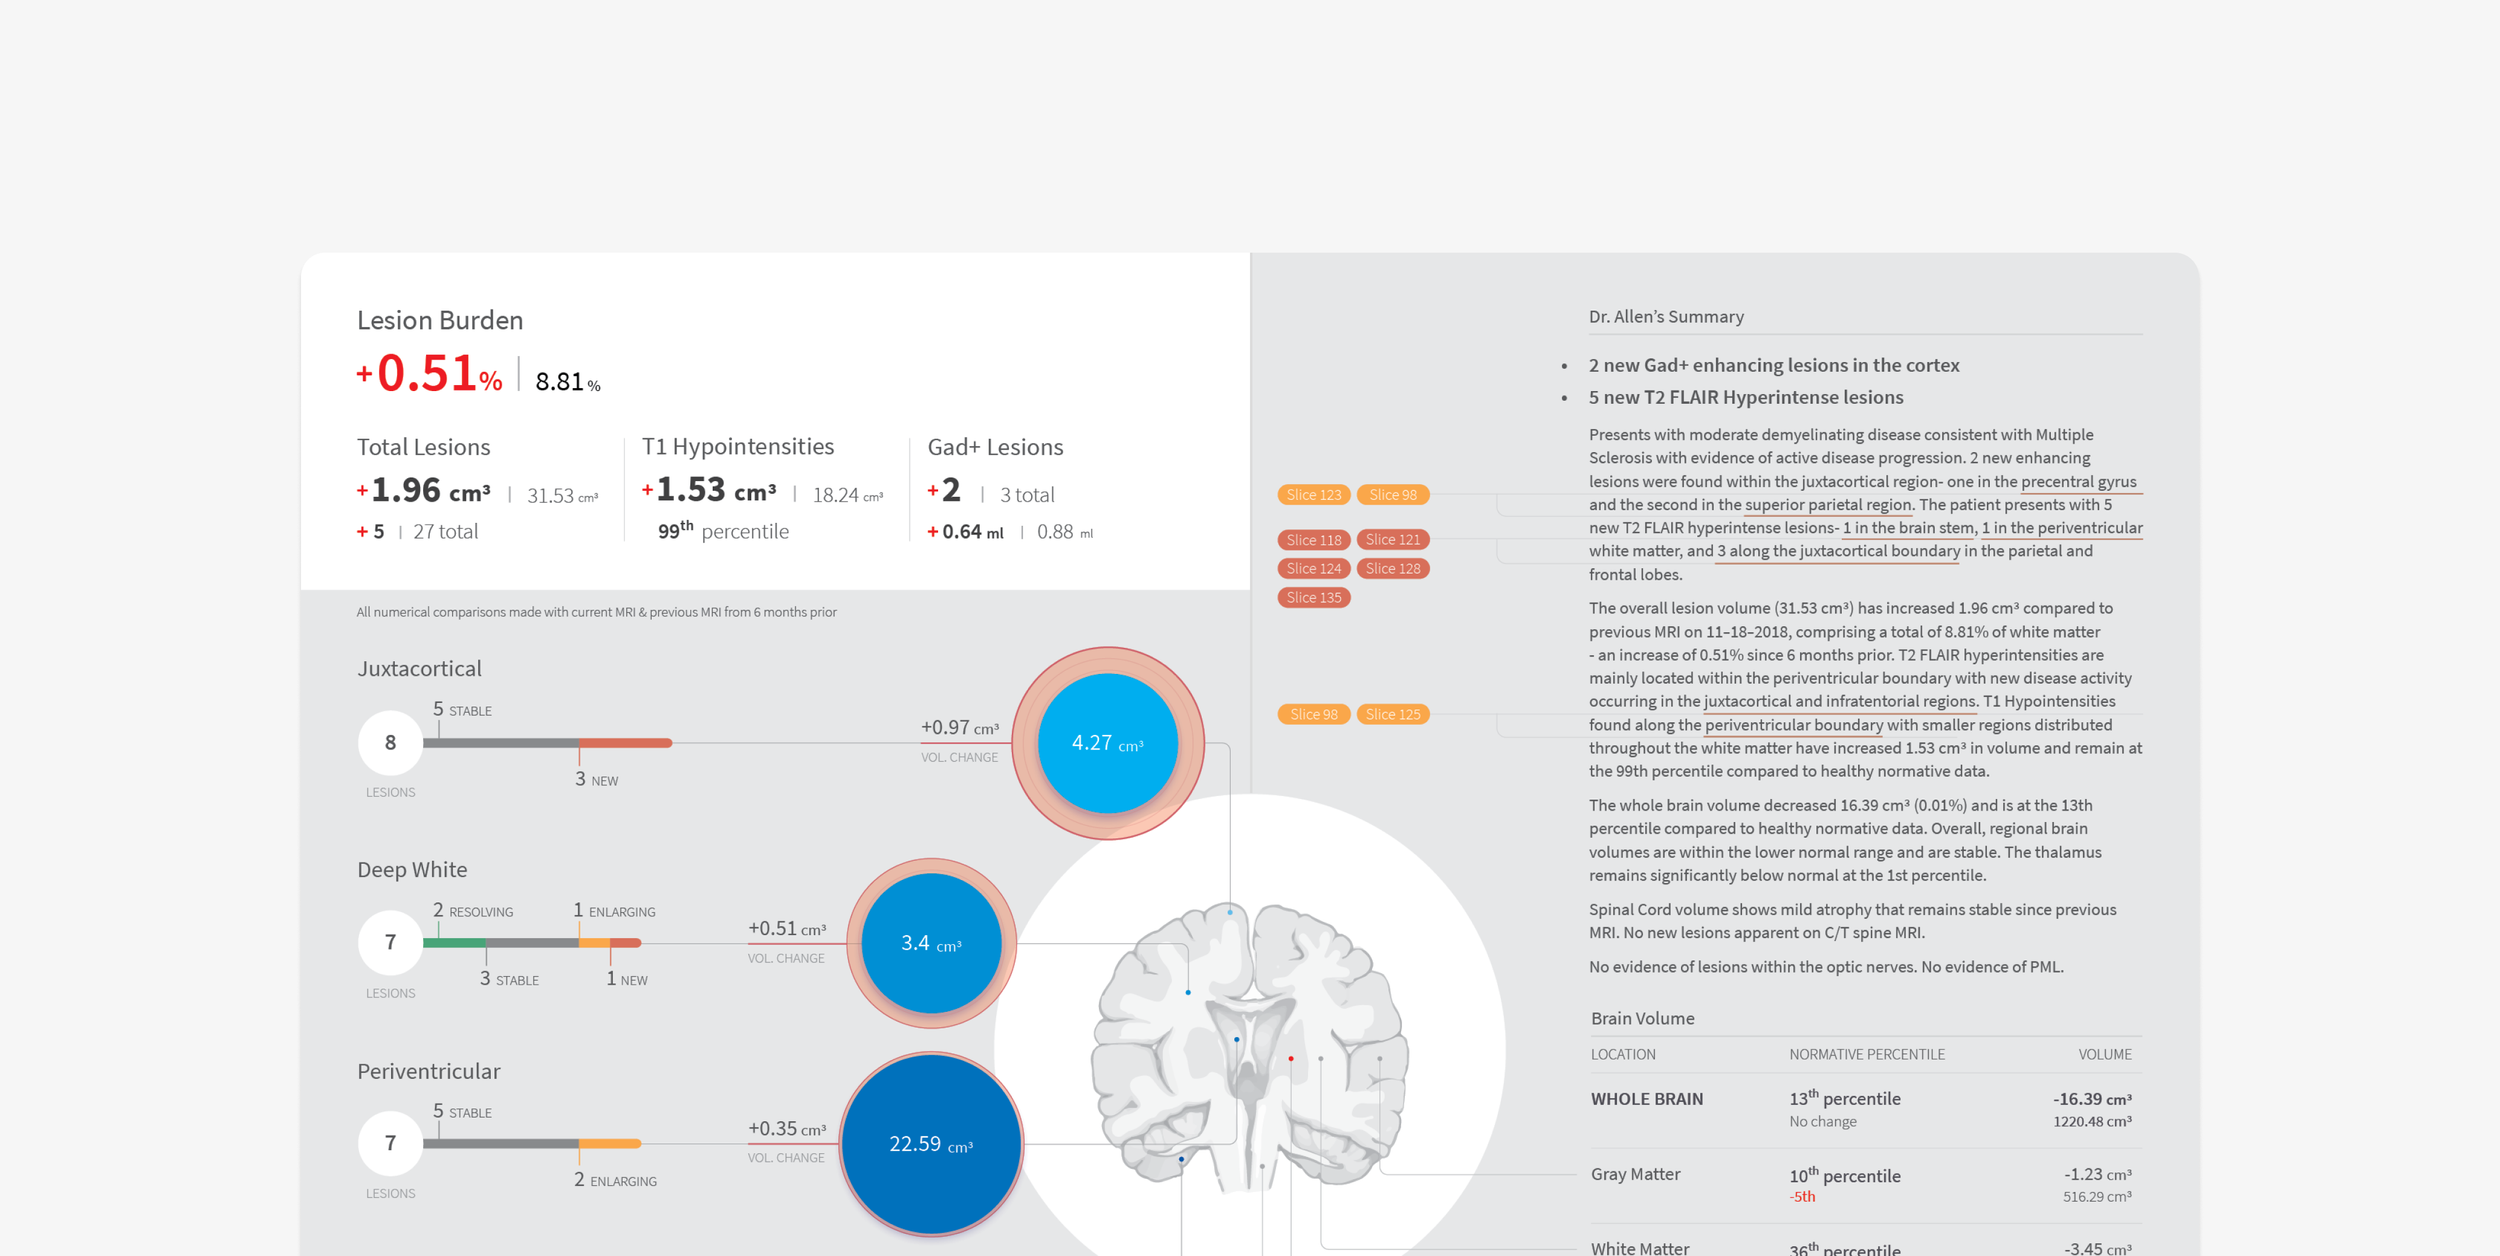
MRIs are integral to MS treatment, but neurologists were stuck in manual processes such as counting lesions. With emerging technology that could automate counting and calculate brain lesion volume for more precise analysis, we needed to validate whether neurologists would actually use this capability and whether to include it in our service offering.
Outcomes
This project was different as my role was to come up with an MRI report concept and to test and learn from neurologists in a conference in 6 weeks before handing it off to another designer who would design the next iteration so that I could go back to designing the app and nurse service that I was responsible for.
I successfully designed the first iteration of the report and tested it with nine neurologists at the American Academy of Neurology conference.
NEUROLOGIST FEEDBACK
89%
of neurologists rated this MRI service as highly likely to use in testing sessions.
NEUROLOGIST FEEDBACK
+1.9
in confidence rating of treatment decision from neurologists with this summary from 4.2 to 6.1.


1 Framing and Requirements
2 Study Plan & Concept Exploration
3 Testing & Synthesis
As this project had a short turnaround, I collaborated closely with the PM to get quick alignment and fast decisions, especially on the emerging product roadmap.
Desired Learning and Requirements
I facilitated a series of working sessions with the MRI PM where we stress-tested our assumptions for the current release and explicitly mapped how these decisions would support future extensions of the MRI service.
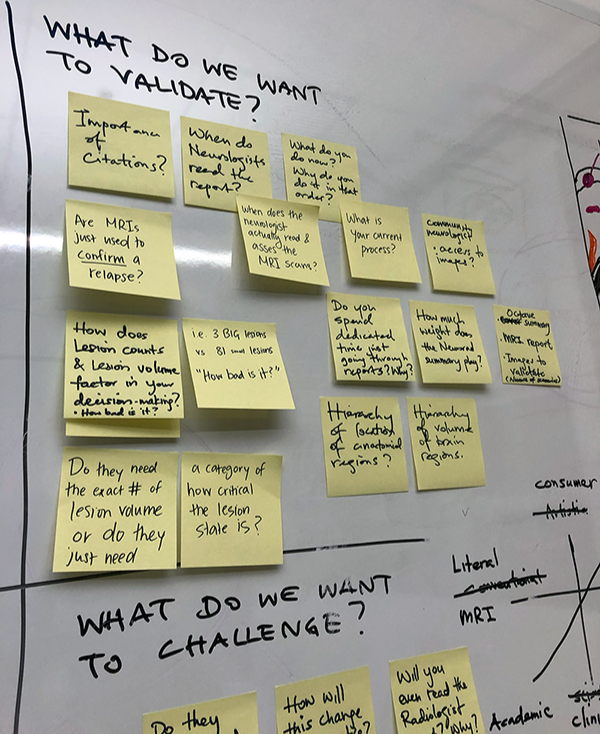
We needed to understand how the report fit into their decision-making. We decided that half the time in our sessions would focus on their process.
Neurologists didn’t always use the same terms for brain regions. We decided to center our designs around a brain visual in the report to create a shared language.
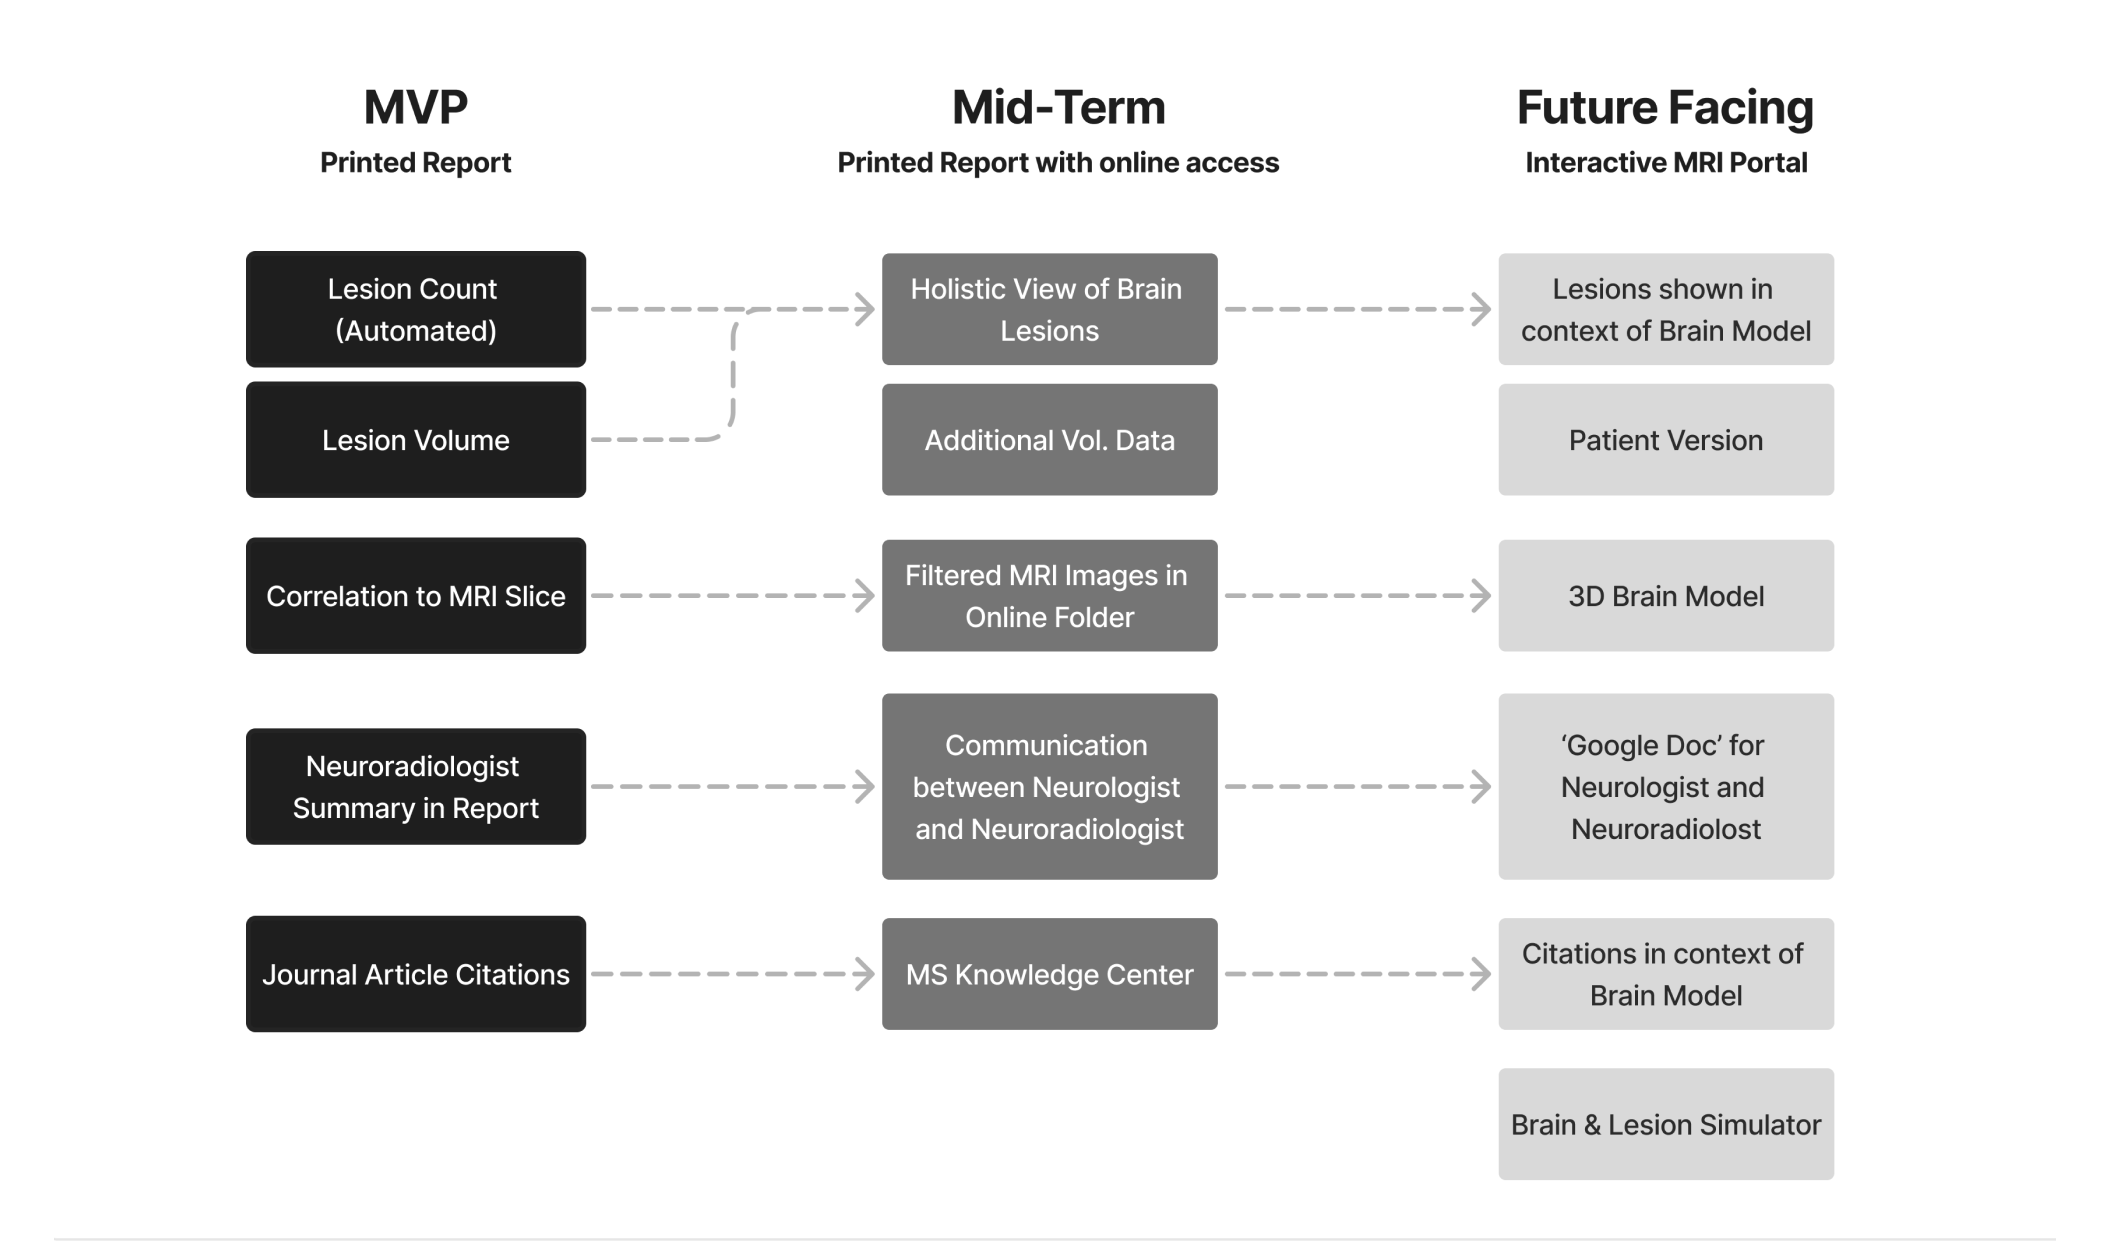
While it was important to focus on the now, the PM and I explored concepts on the mid-term and future. We decided to start with a streamlined report first, layer in customization options mid-term, and build collaborative features and services for the future.
Quick Audit of Competitors
Our competitors were giving neurologists MRI images and dense reports. But we knew these neurologists were overworked and needed to make quick decisions.
We decided to have visualizations that cut through the noise—help them see the important data points right away instead of wading through all the data.
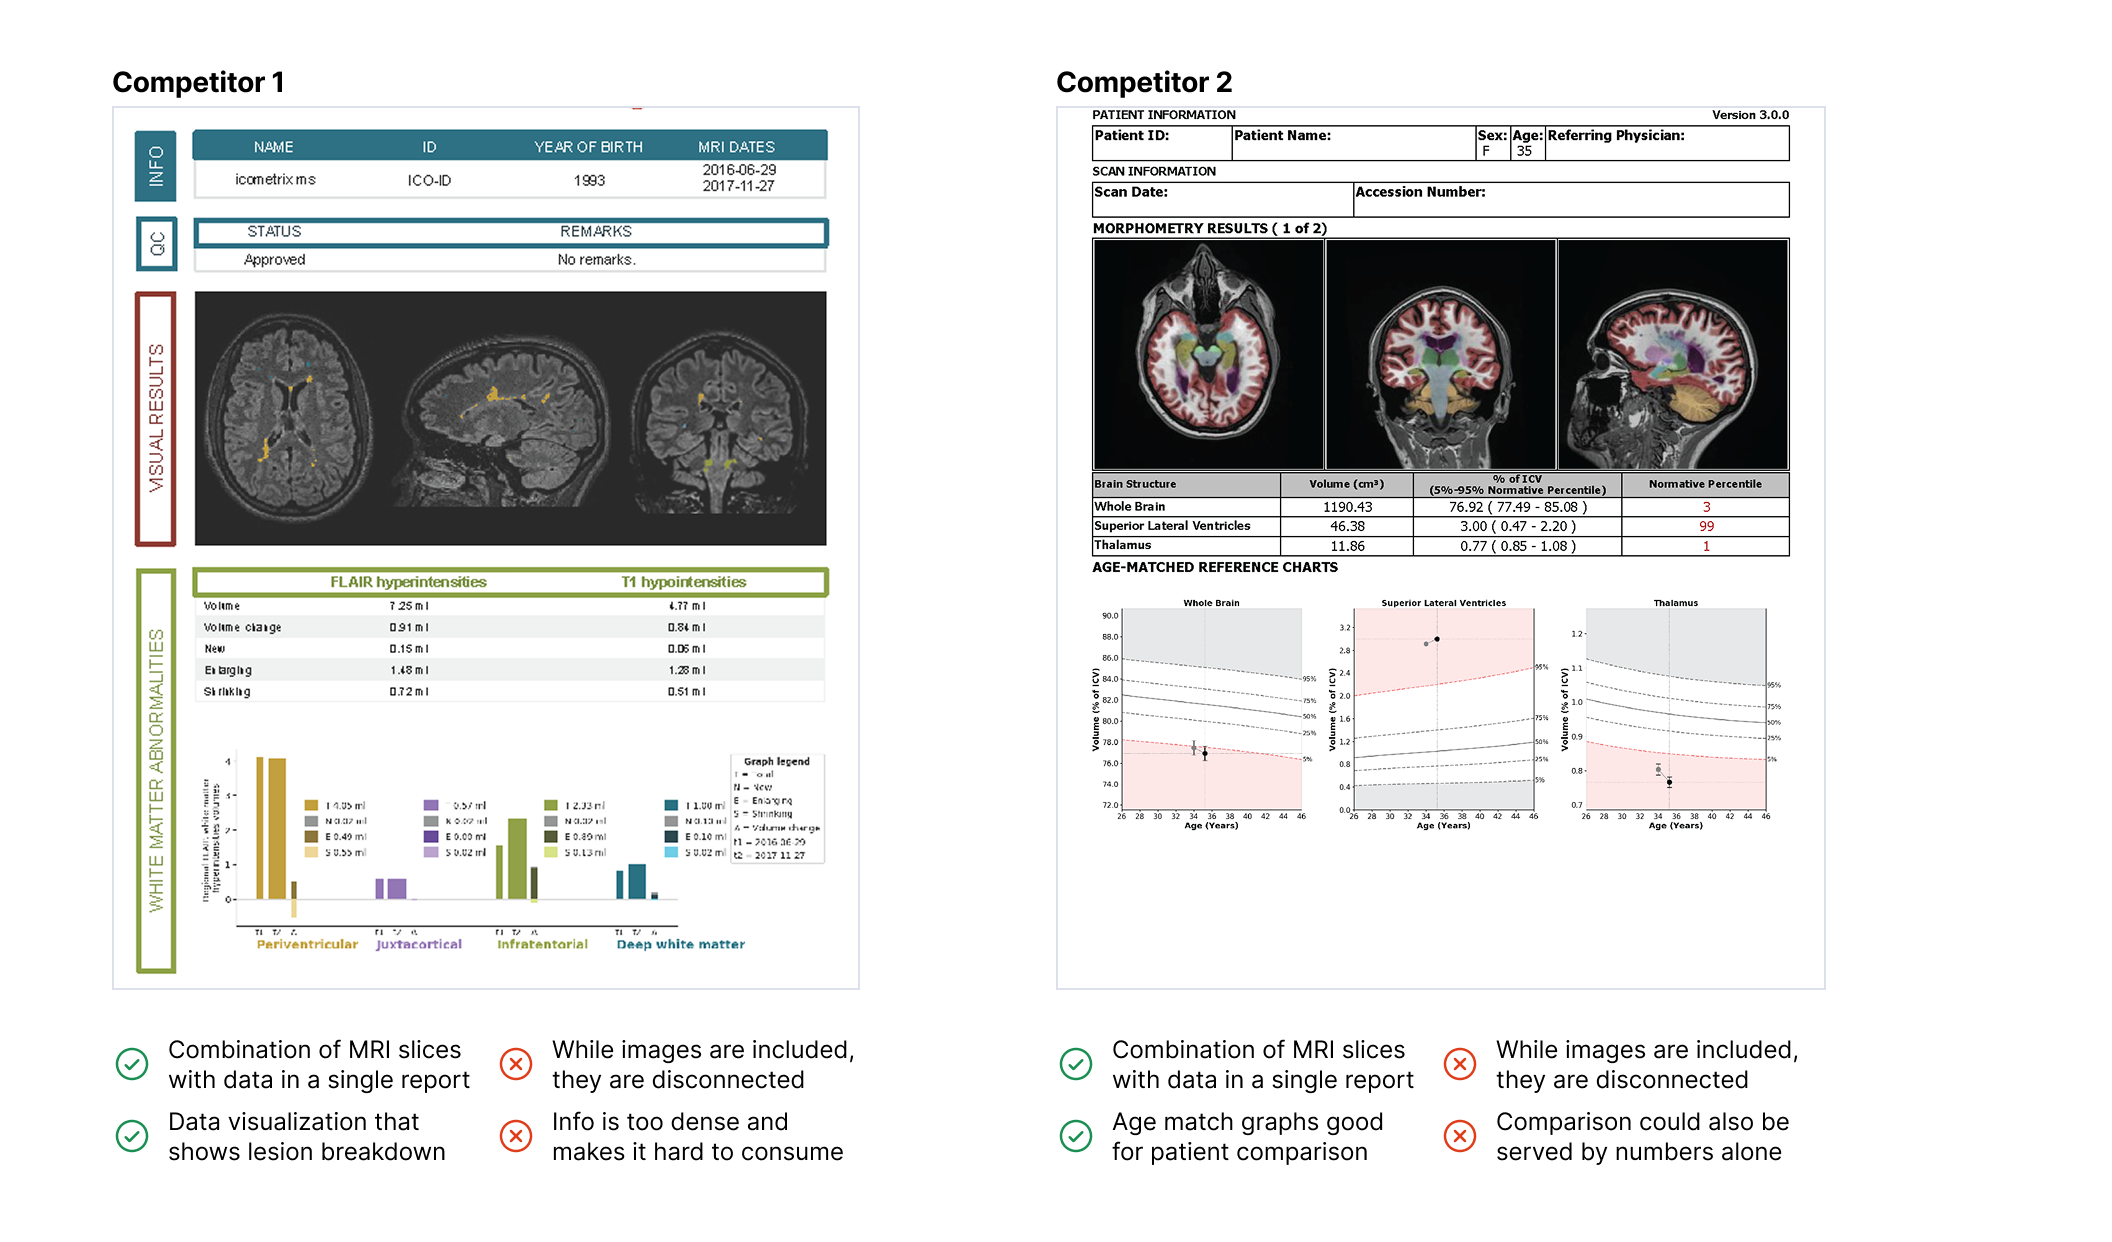
Competitors included MRI images with colored lesions and dense data visualizations to tryy to provide value in the report. We decided to keep things simple and not include MRI images and have data visualizations for faster understanding rather than more depth.
1 Framing and Discovery
2 Study Plan & Concept Exploration
3 Testing & Synthesis
I prioritized moving quickly and taking ownership, sharpening what we aimed to learn and shaping the MRI report so it would move us forward and prompt richer conversations with neurologists.
Defining the Research Study
I aligned with the PM and the leadership team on key areas we wanted to learn for this MRI services, the key data that we needed to support, and how they would use the MRI in their treatment decisions.
I – Experience Map Activity
Purpose: Map the current MRI journey end‑to‑end, surface friction and variability, and understand where a new MRI service could reduce cognitive load or risk without breaking existing habits.
Hypothesis: The main bottleneck in leveraging MRI for MS is not access to the scan, but transforming a long, text‑heavy report and image set into clear, actionable conclusions about disease activity and treatment changes.
II – Data Hierachy Activity
Purpose: Identify which MRI measures neurologists actually use, which they wish they had, and how they prioritize them when making real treatment decisions, especially for MS.
Hypothesis: If the measures that are most predictive of meaningful MS outcomes are consistently highlighted in a simple and repeatable way, then clinicians will gradually shift from purely qualitative impressions toward more data driven interpretations of disease activity and progression.
III – MRI Report Discussion
Purpose: Evaluate whether a new visually rich MRI report, that showcases volumetric metrics and a Neuroradiologist summary, improves perceived usefulness, trust, and treatment decisions.
Hypothesis: If the visual format helps neurologists communicate MRI changes to patients without oversimplifying or misrepresenting the science, then the report will be seen as a tool that improves both clinical reasoning and shared decision making.
Concept Exploration & Refinement
A tight timeline eliminated broad concept exploration, forcing me to dive deep into a select few high leverage ideas and iterate rapidly. This constraint actually accelerated progress by focusing energy on what could be learned and acted on quickly, giving the team space to move forward with clear next steps rather than chasing endless possibilities.
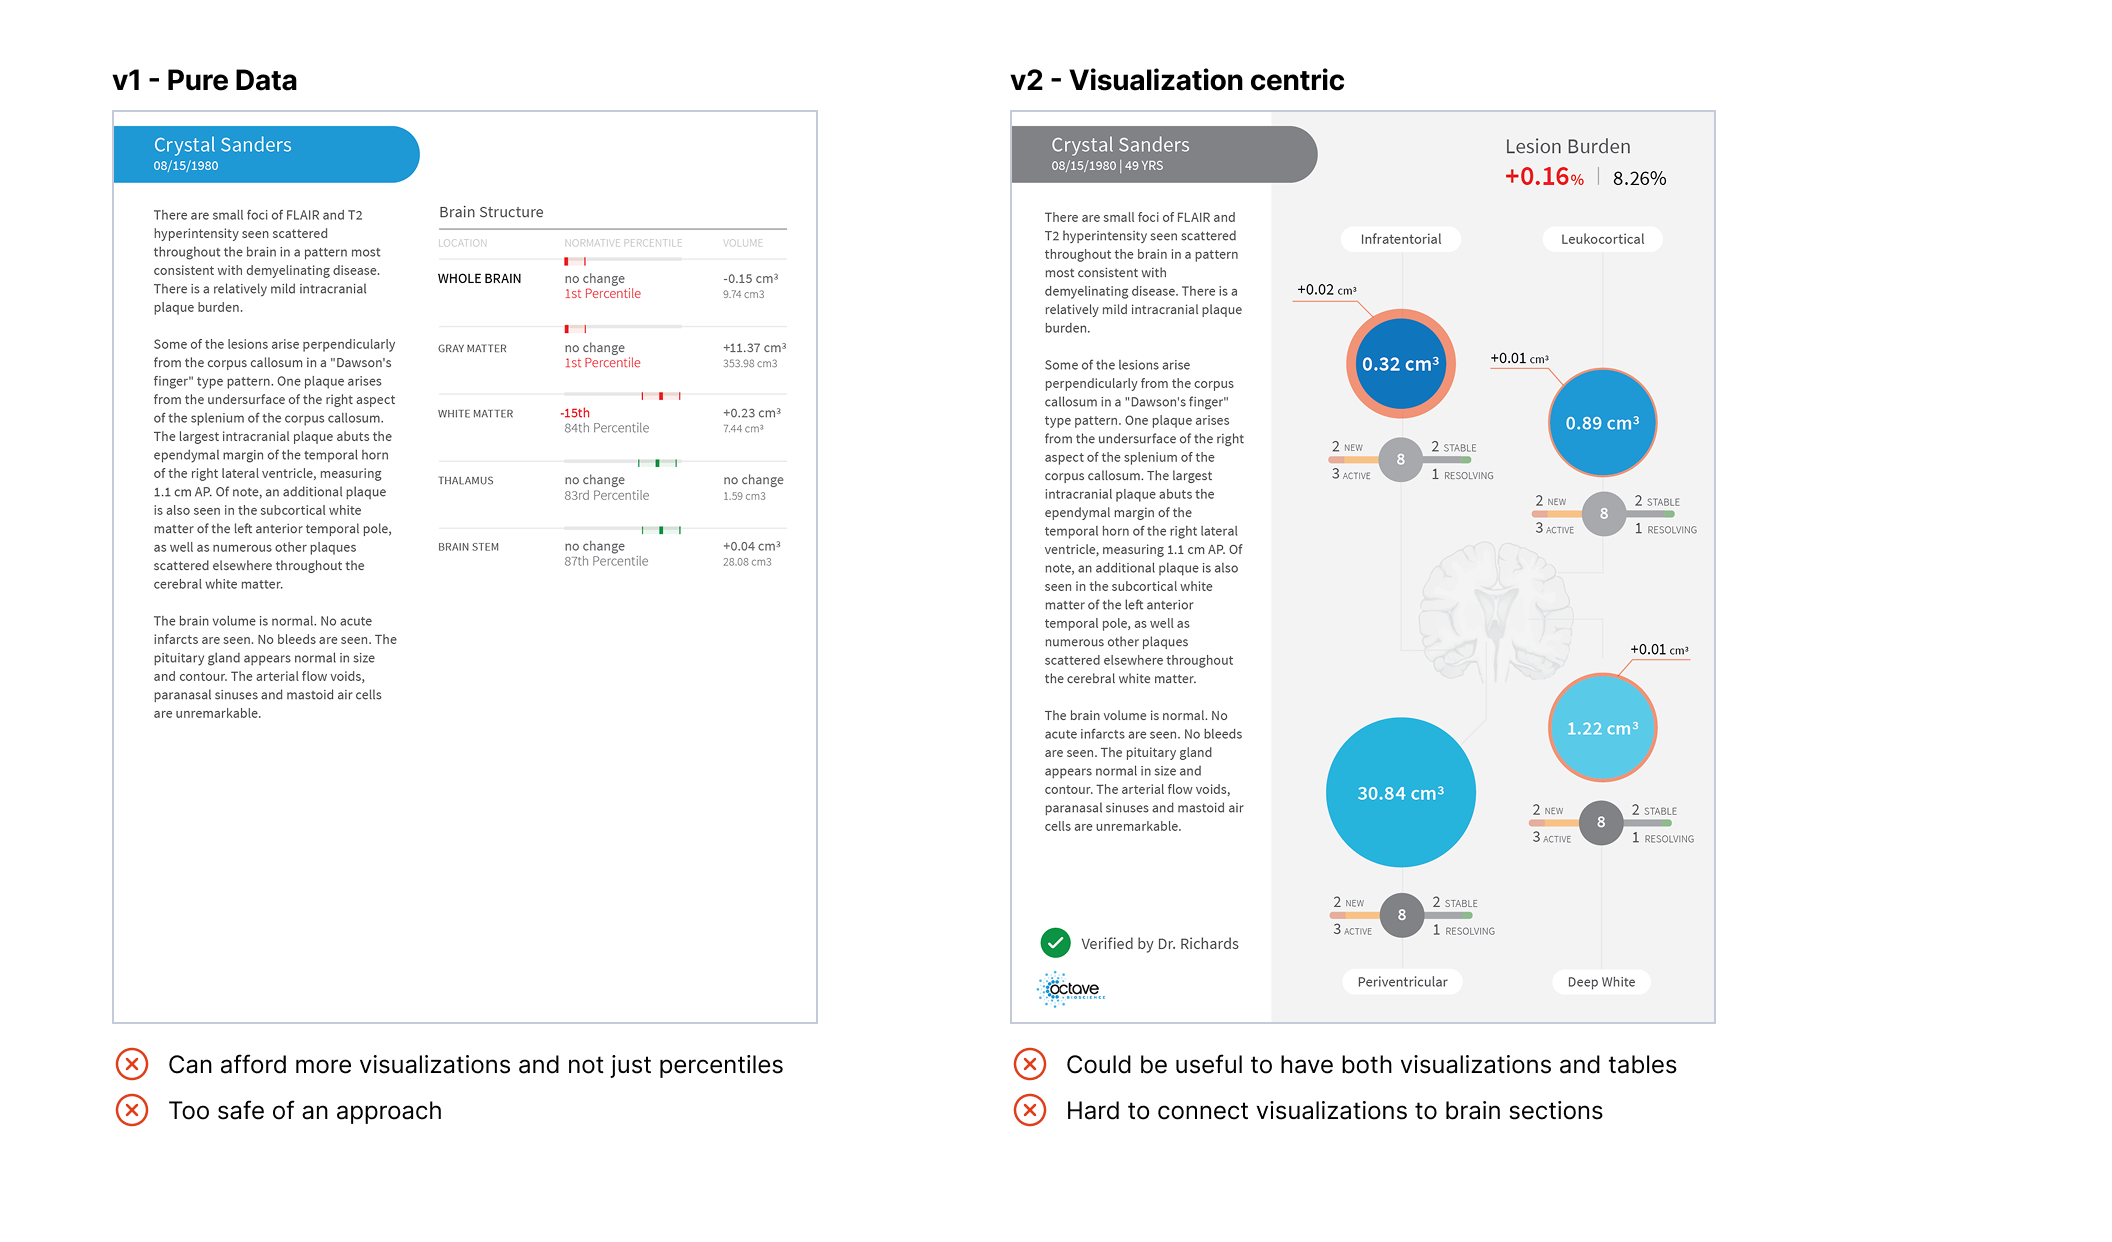
Most competitors used single-sheet reports to make it fax-able so I started there too. But I quickly realized one sheet wouldn’t give us enough room as we wanted to show more data. I convinced the PM to expand to two sheets, at least for this concept study.
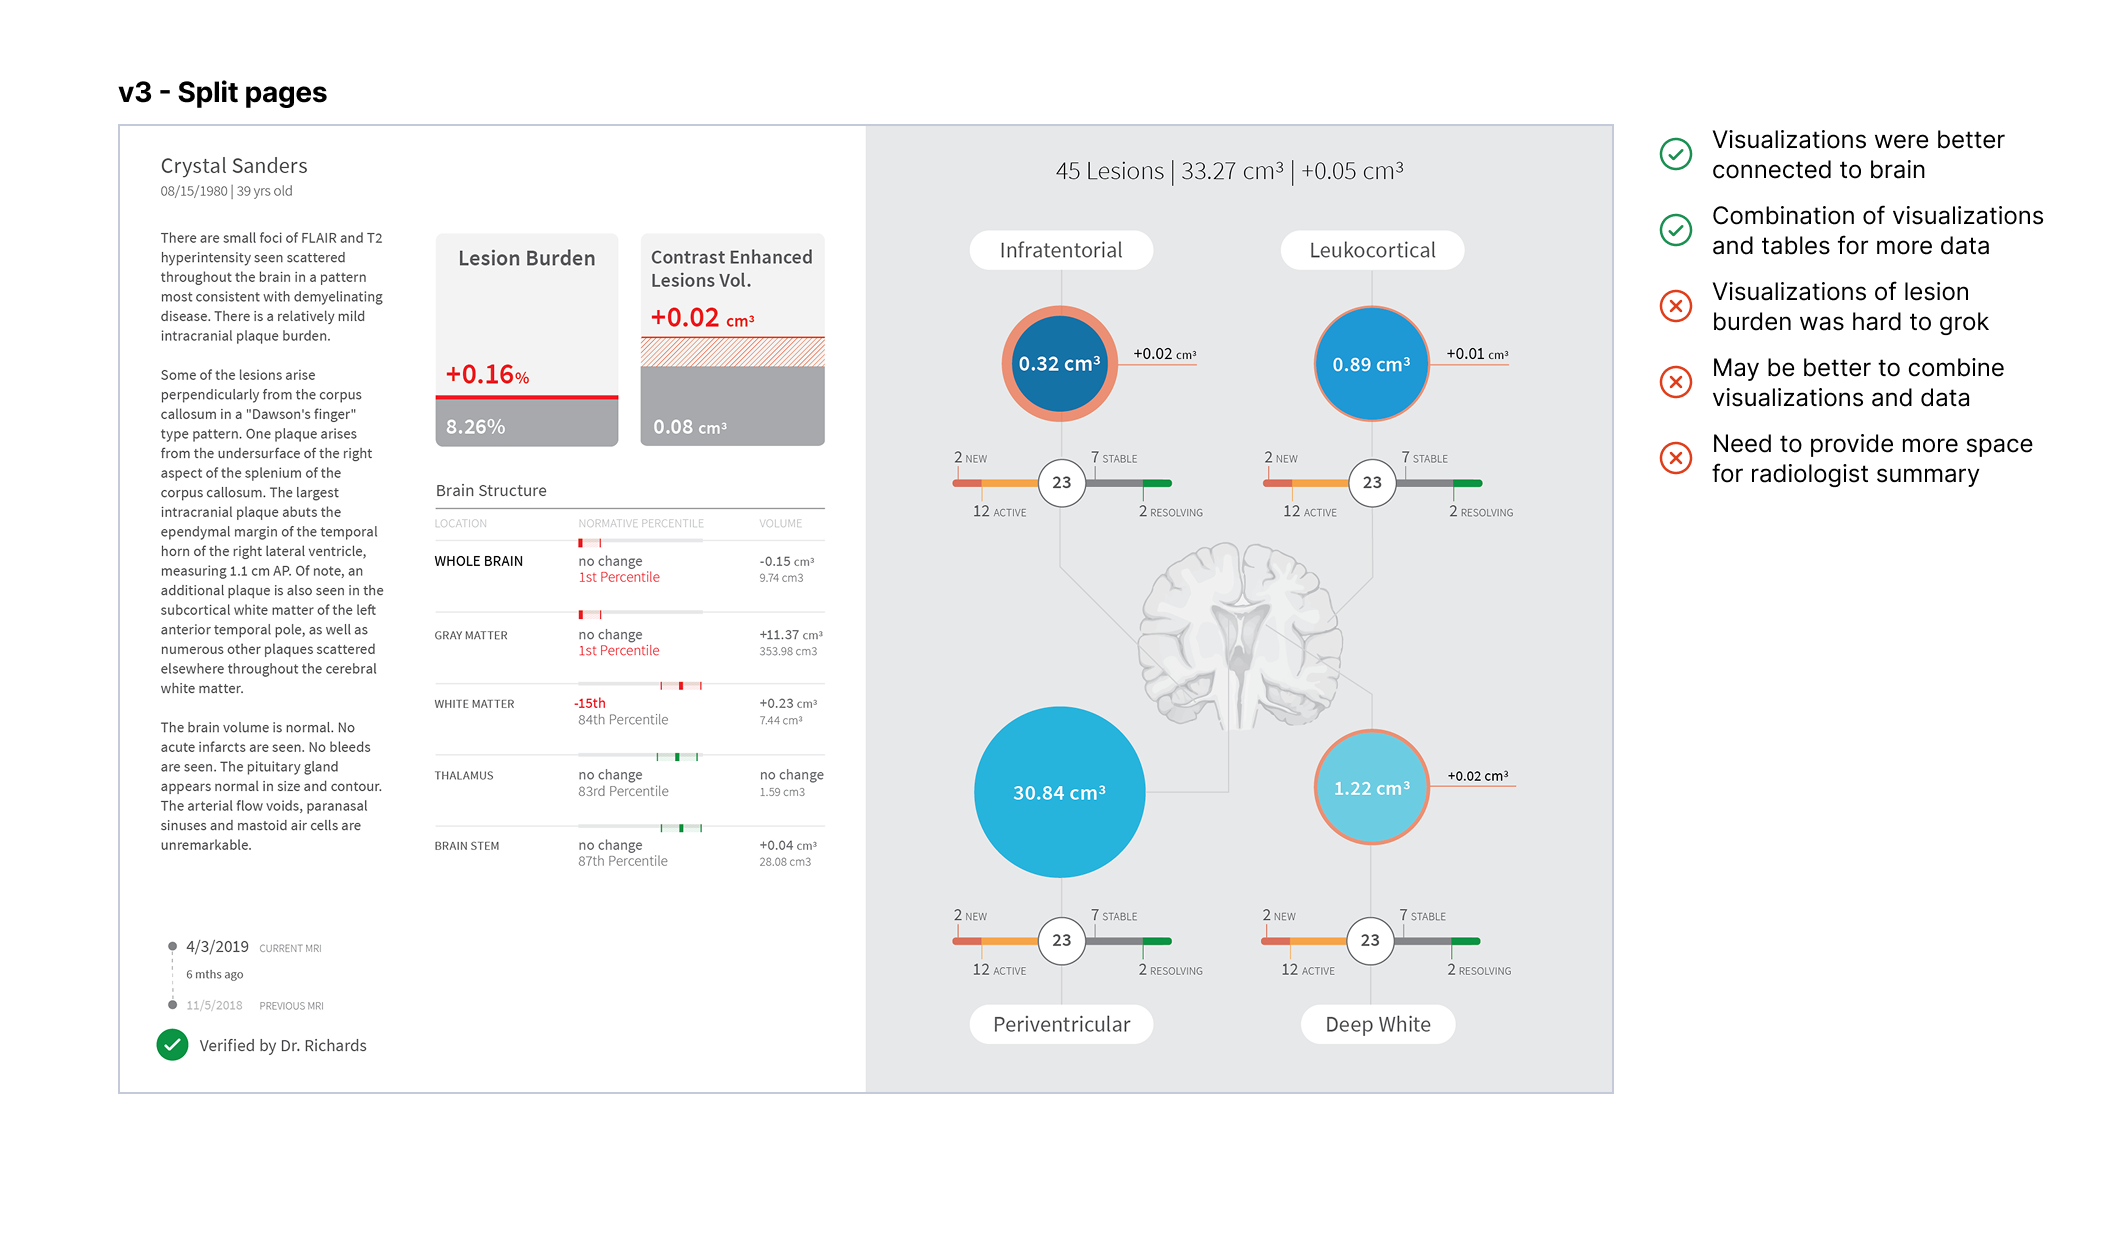
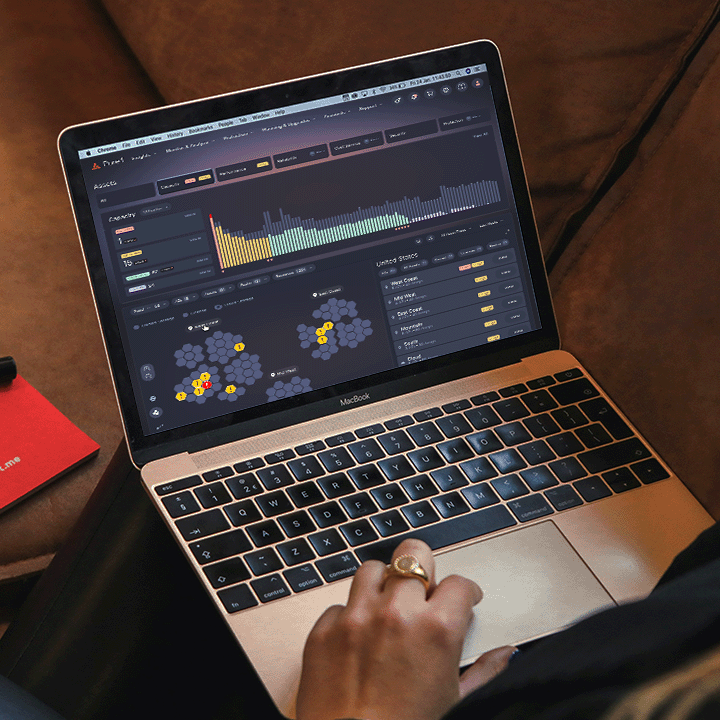
For better hierarchy, I decided to place the key metrics and visualizations on one page with the radiologist summary and other supporting data so as to delineate the information more clearly so it aligned closer to what they were used to.
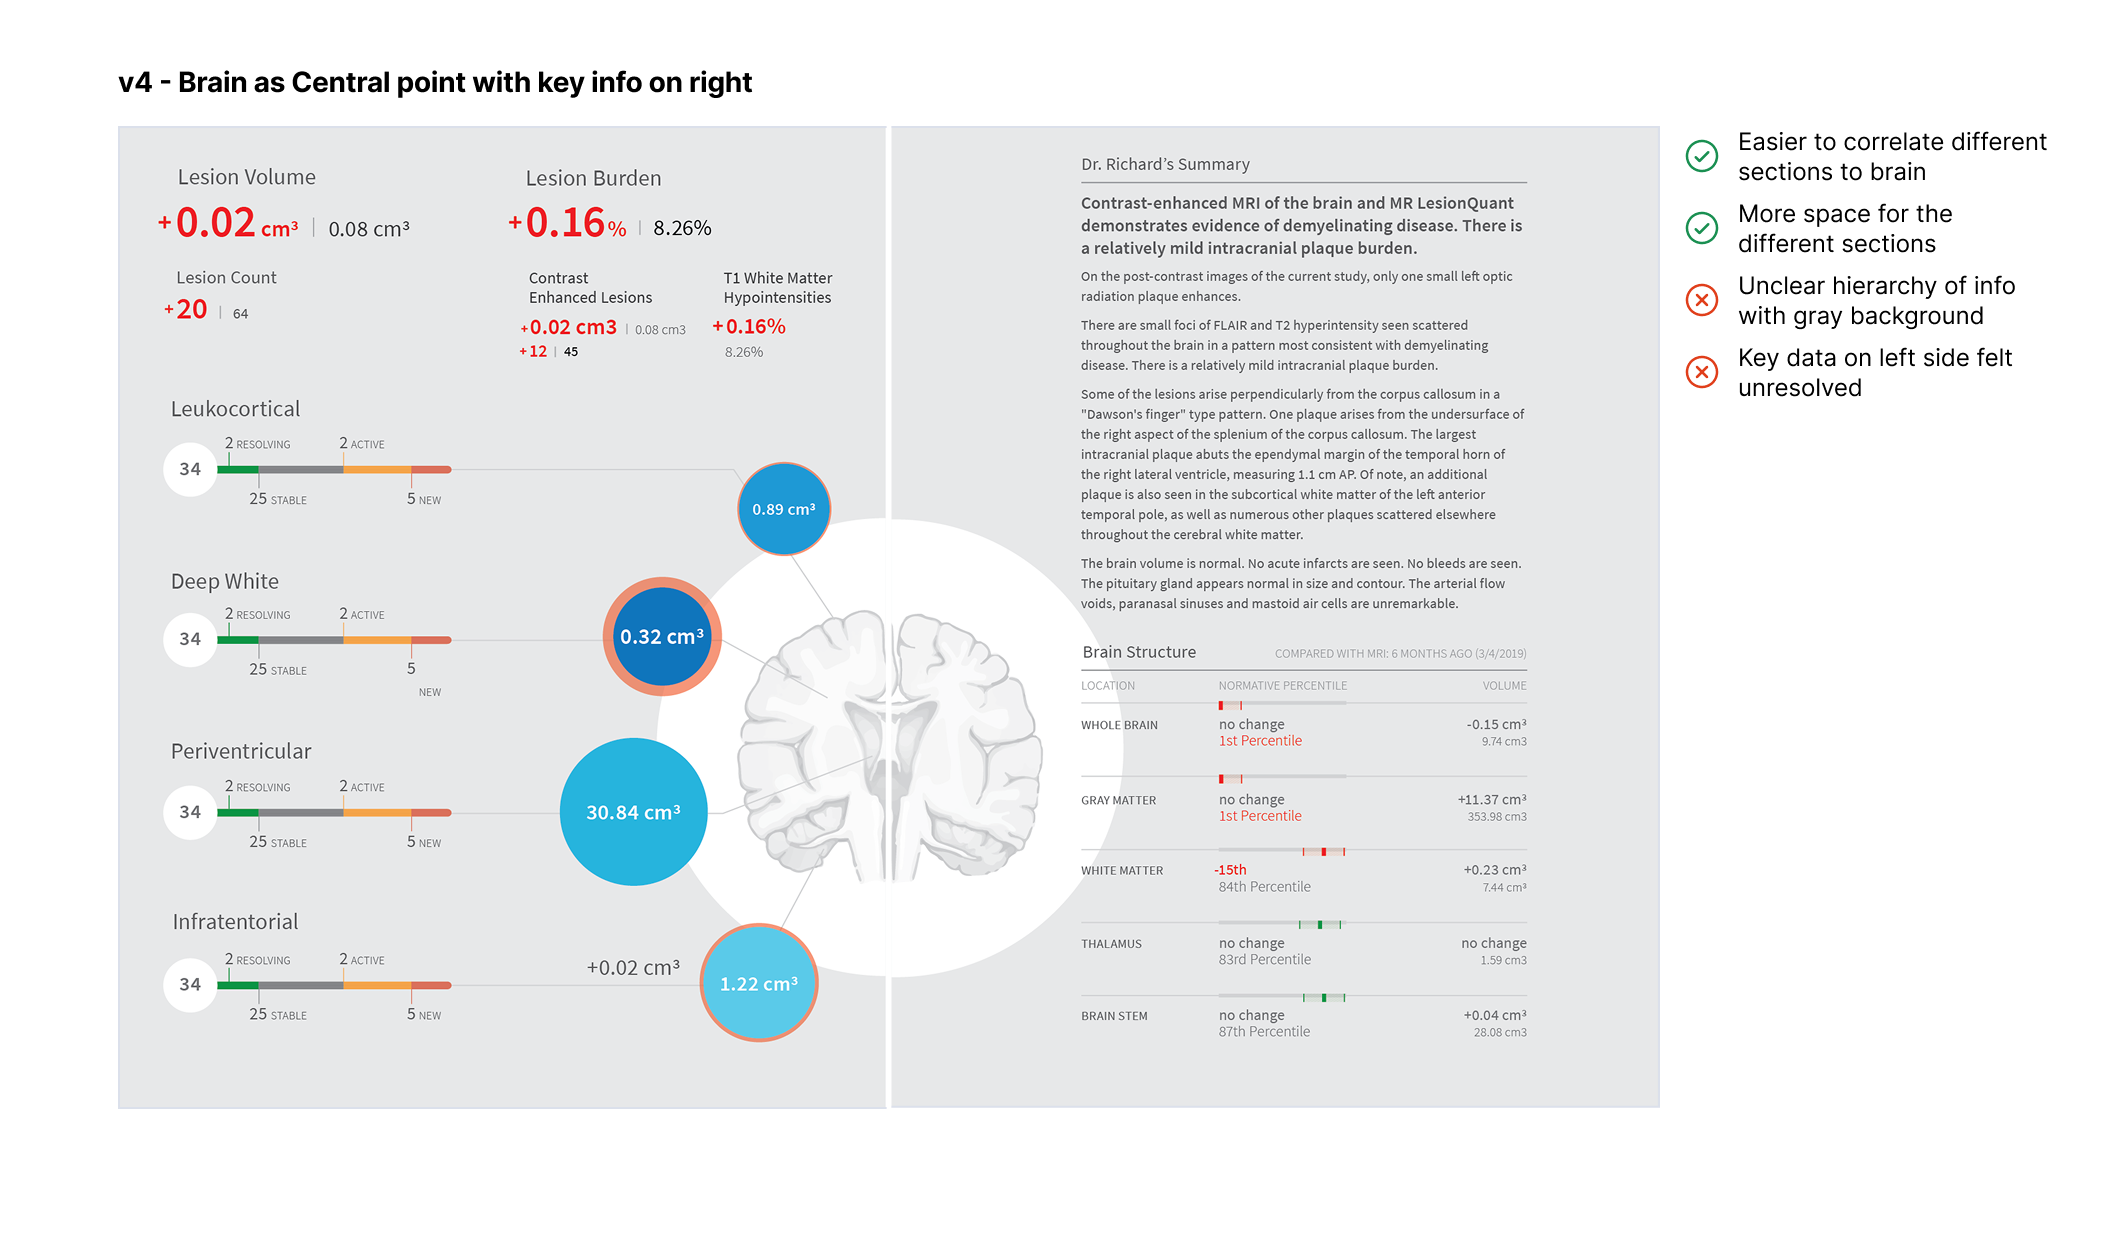
To provide more space for the radiologist summary and to better connect the lesion data to the brain without having to over rely on labels, I adjusted their positioning for easier scannability.

1 Framing and Discovery
2 Study Plan & Concept Exploration
3 Testing & Synthesis
As I was also designing the app and nurse service for this startup and was urgently needed back on that track. I worked quickly to synthesize and hand over the learnings and designs to another designer who would take over in a few weeks and build upon this body of work for the next iteration.
Executing the Concept Tests with Neurologists
I conducted the interviews, experience mapping discussion, card sorting, and concept tests with nine neurologists who were a mix of Key Opinion Leaders and Community Neurologists at the American Academy of Neurology conference, all in one day.
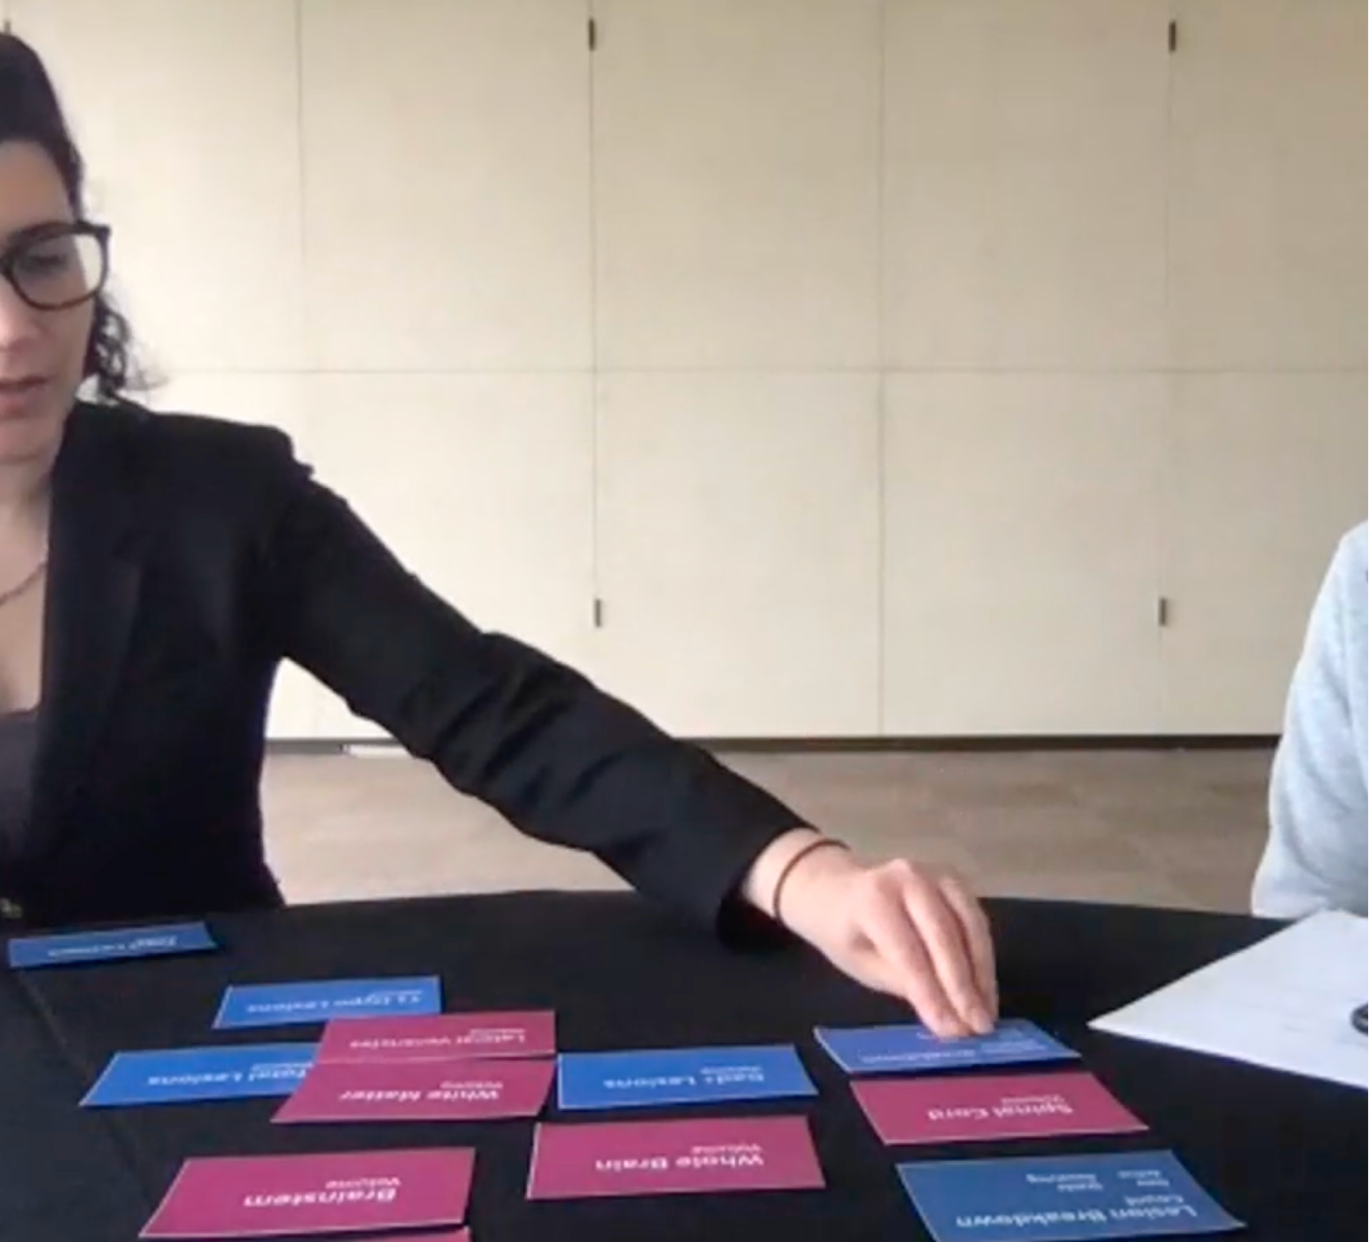
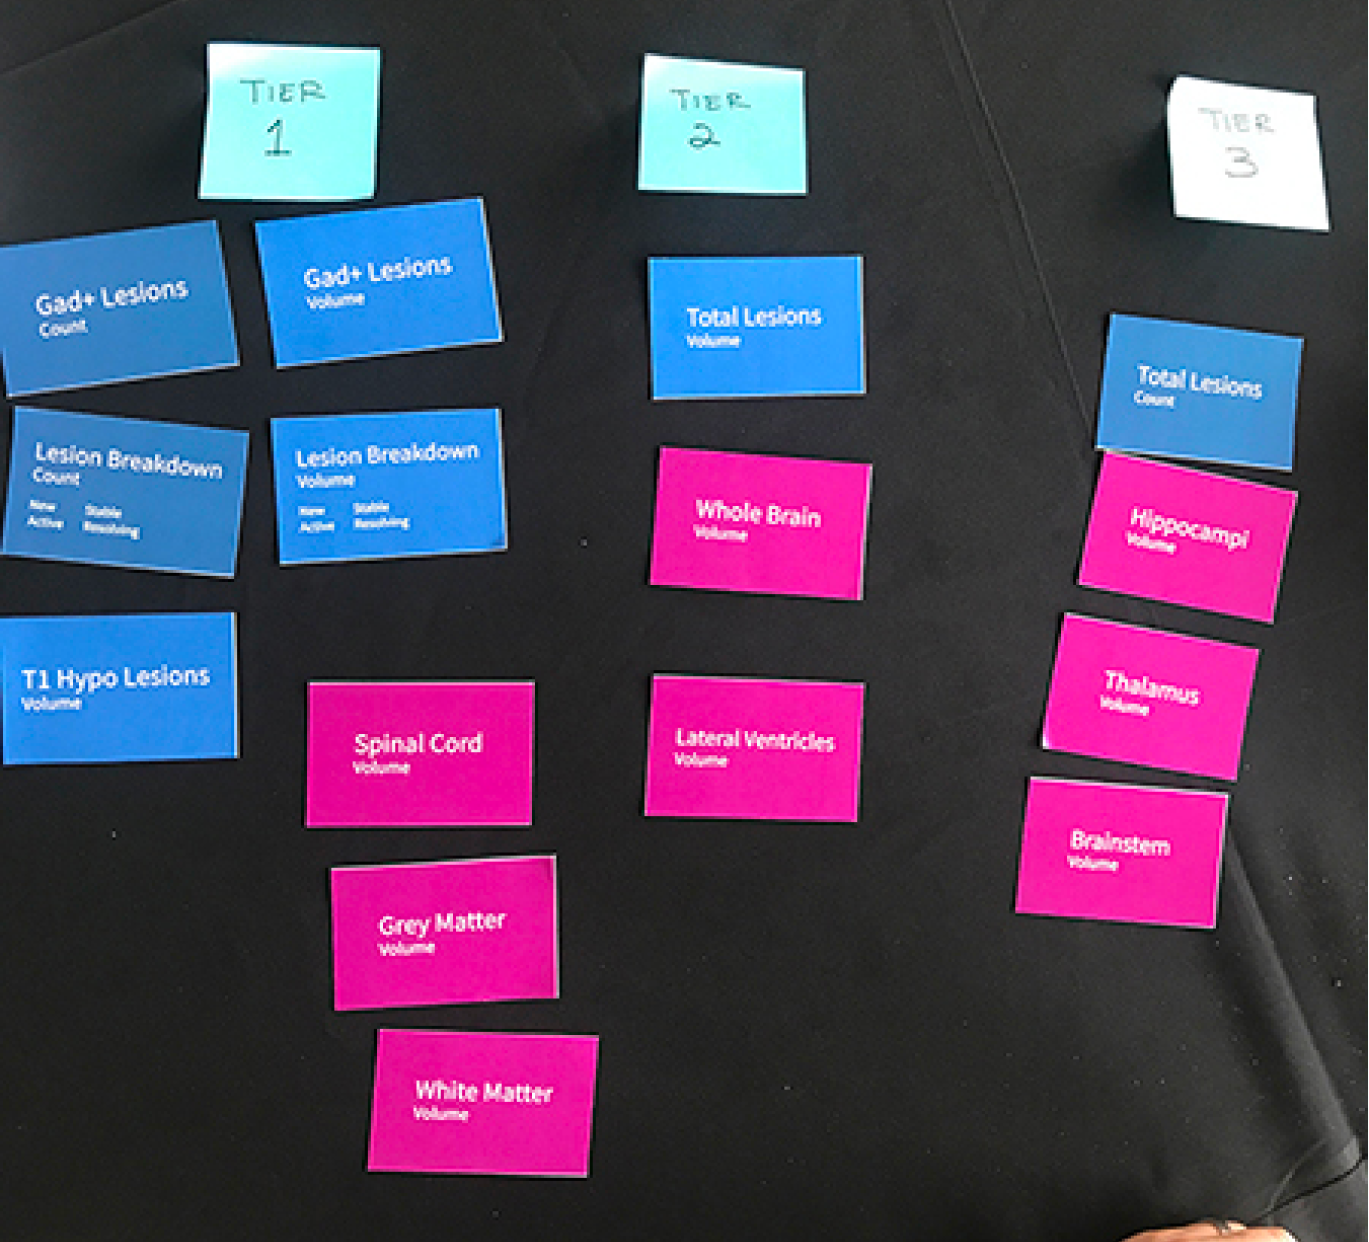
Neurologists ranked the data points from tier 1 being essential to tier 3 being generally useful, allowing us to determine hierarchy of both count and volumetric data for the next iteration.
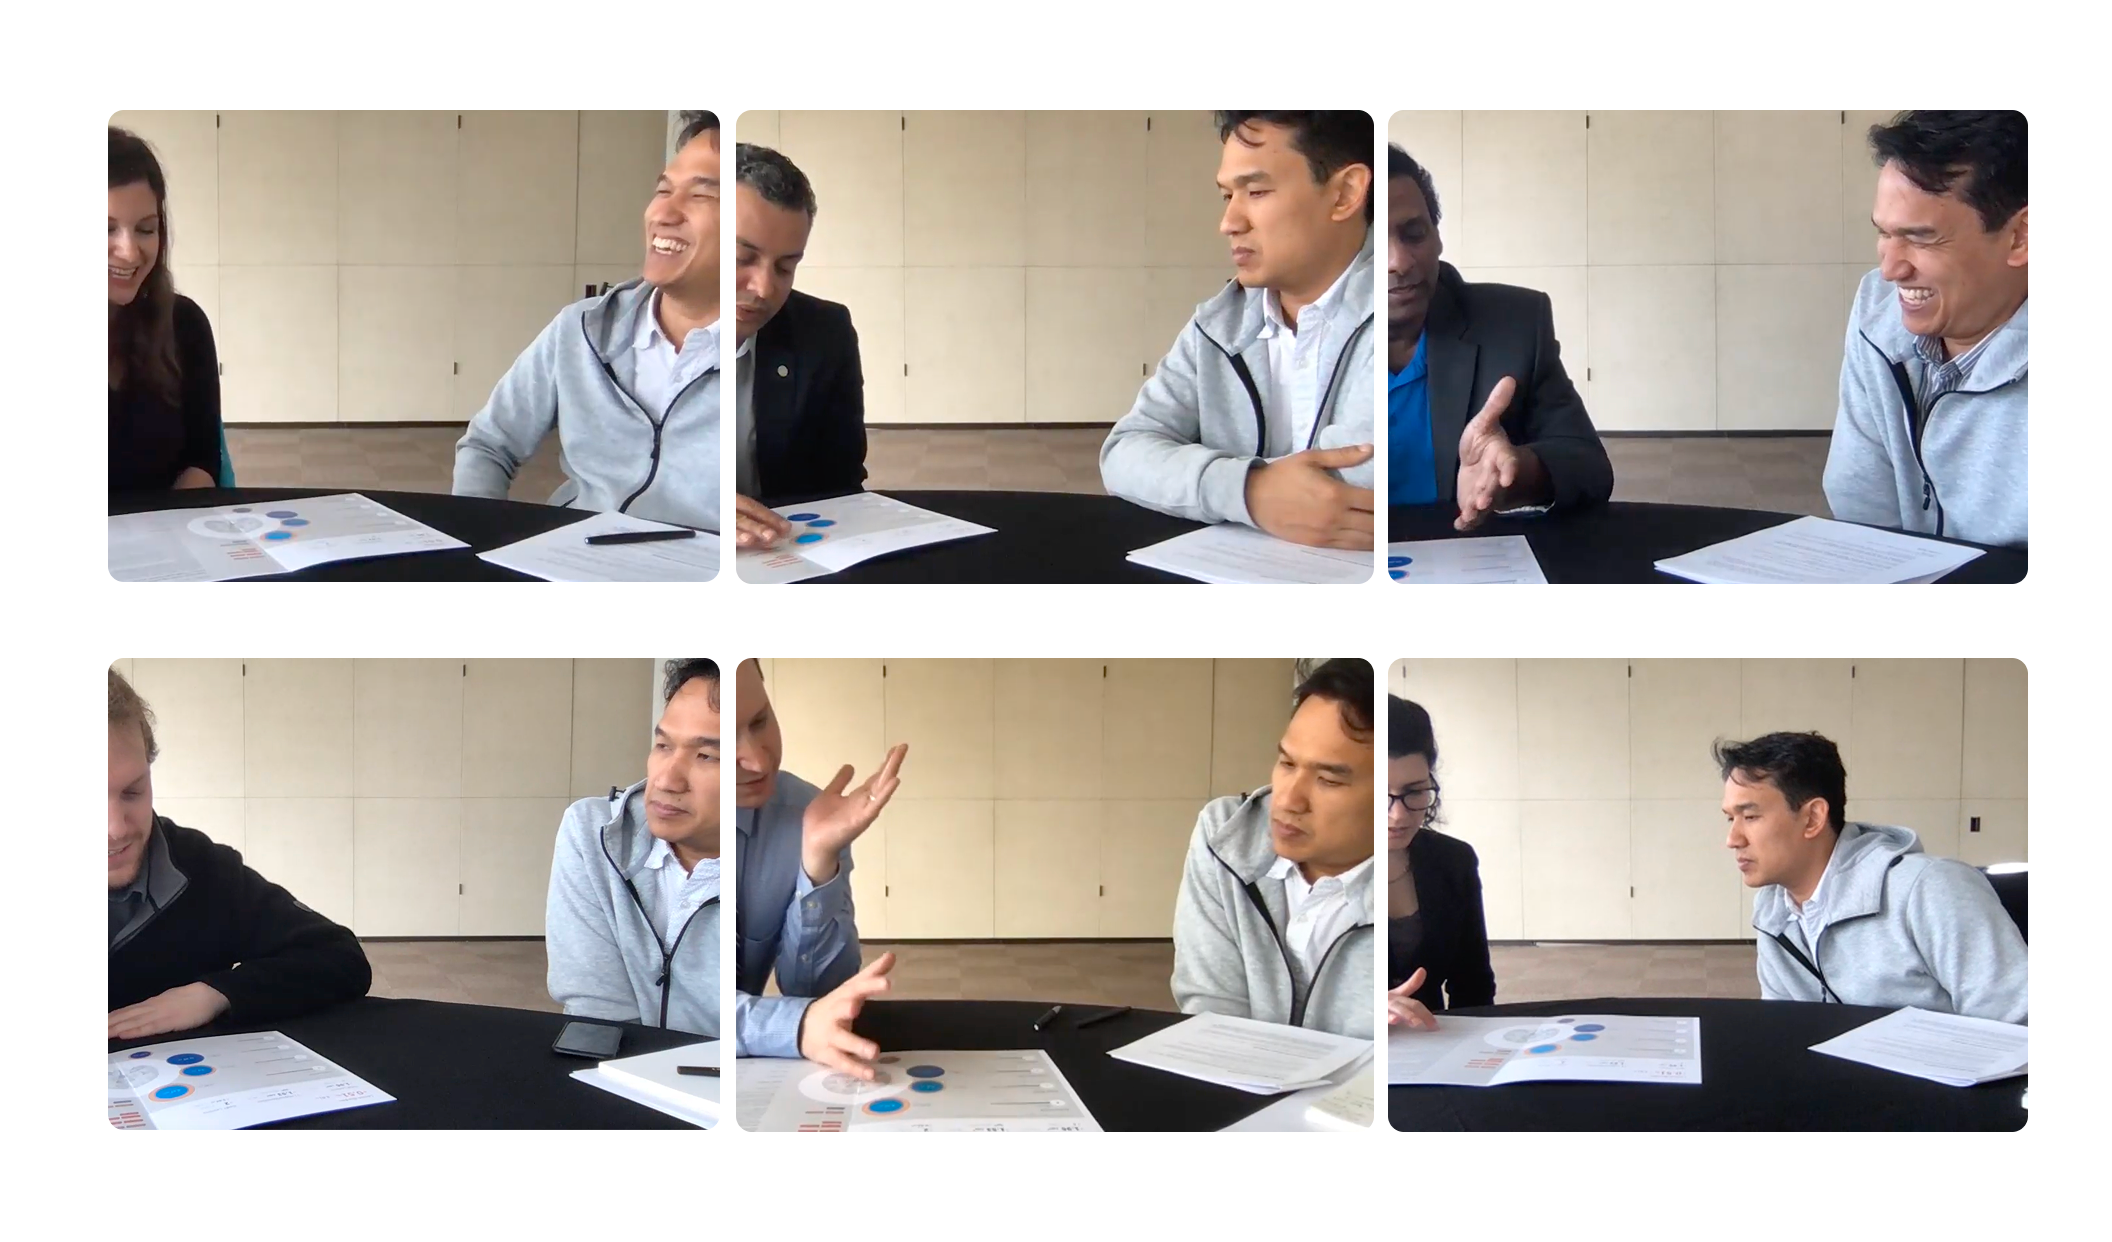
During the concept tests, neurologists were highly engaged and their feedback was very positive. What stood out was not just the volumetric data, but the visualizations that made the report quick and intuitive to scan.
Synthesis & Learning
The concept study succeeded in giving the team confidence that volumetric metrics hold value for neurologists, though as supplementary tools for now. It prompted plans for a follow up research study on treatment decision impact and waiting for additional medical journal validation.
Despite having just days for synthesis, I looked beyond report layout to tackle bigger questions: where to intervene in the full MRI ordering and review process, which data truly mattered, and how to condense it all into one actionable page.
From an overall perspective, I summarized the takeaways into 6 key themes to frame the next iteration that went beyond report layout but broader questions of actionability, balancing future and current practices, and deepening our value propositions.
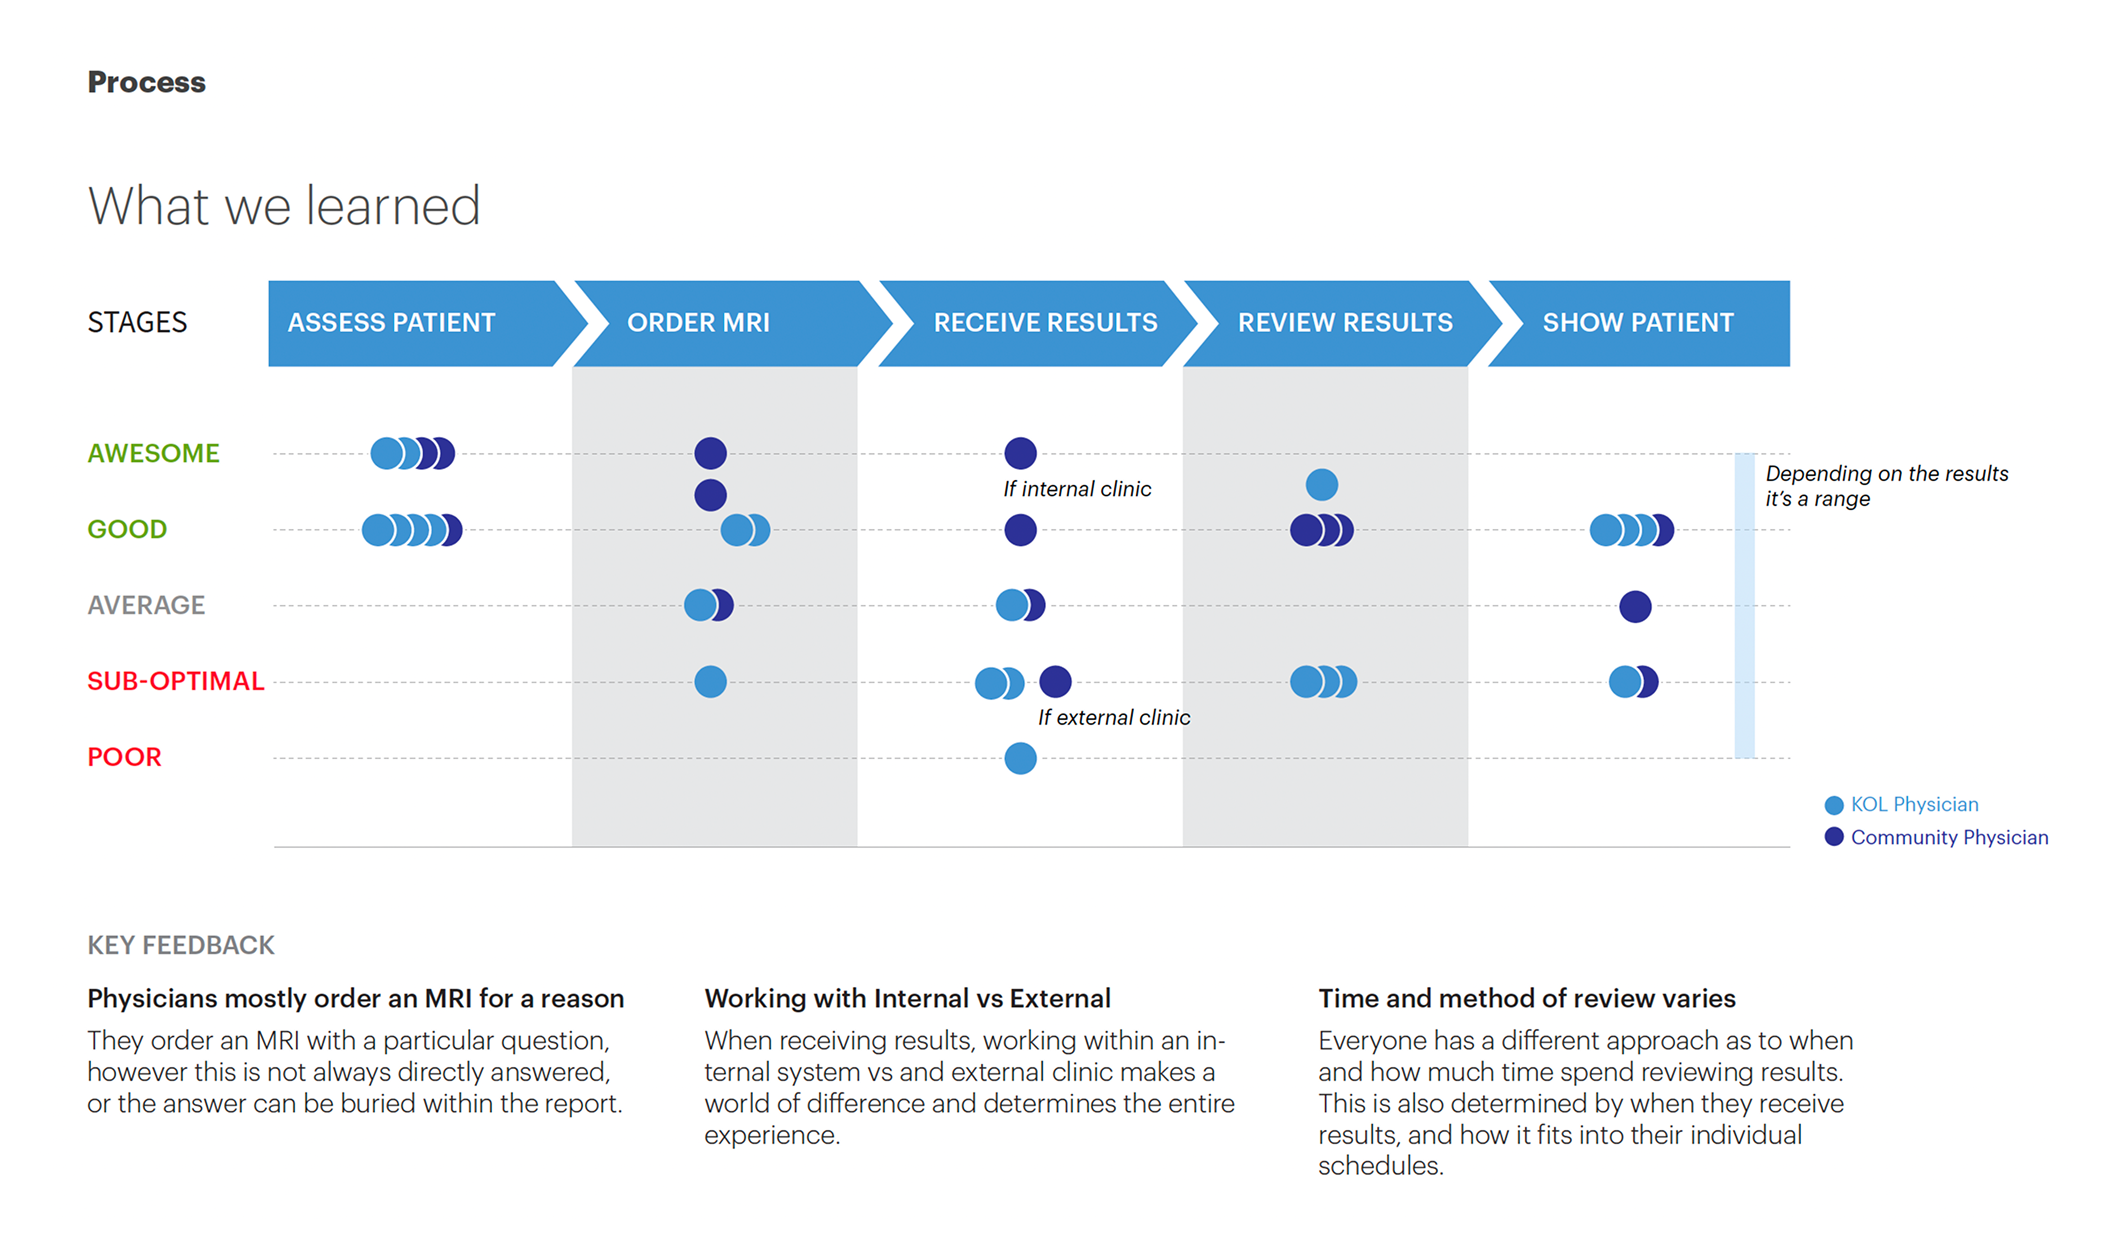
From a process perspective, we learned that the MS Centers we should target first were those who were using external MRI centers as the service quality was usually lower and the lack of follow-up if there were questions.
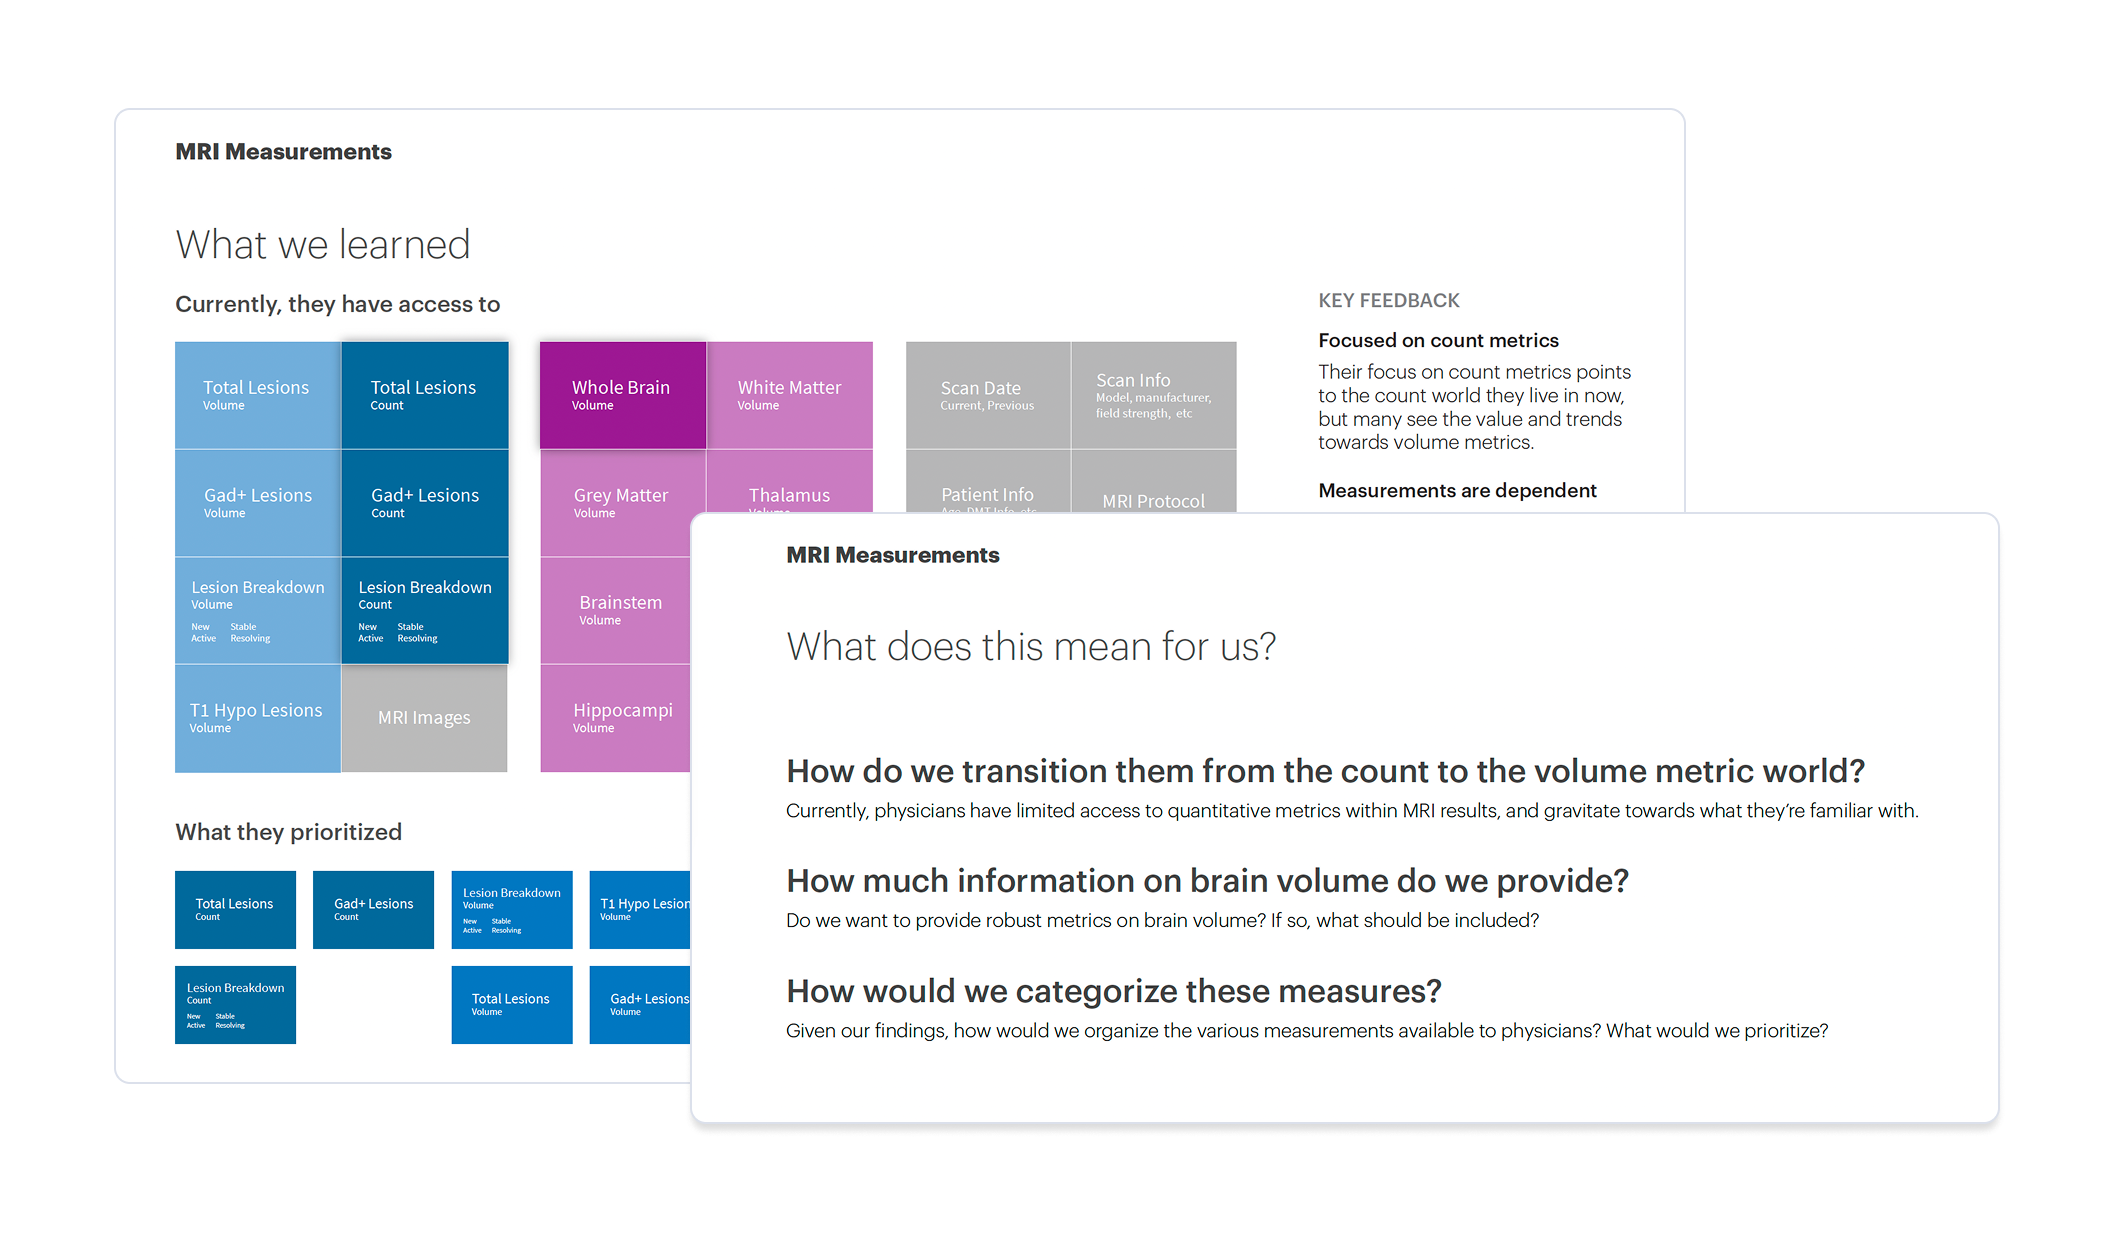
From a data perspective, I shortlisted key data but the broader question was on these volumetric data that was not actionable yet as it was too early in the cycle. We had to find ways to supplement their key data needs.
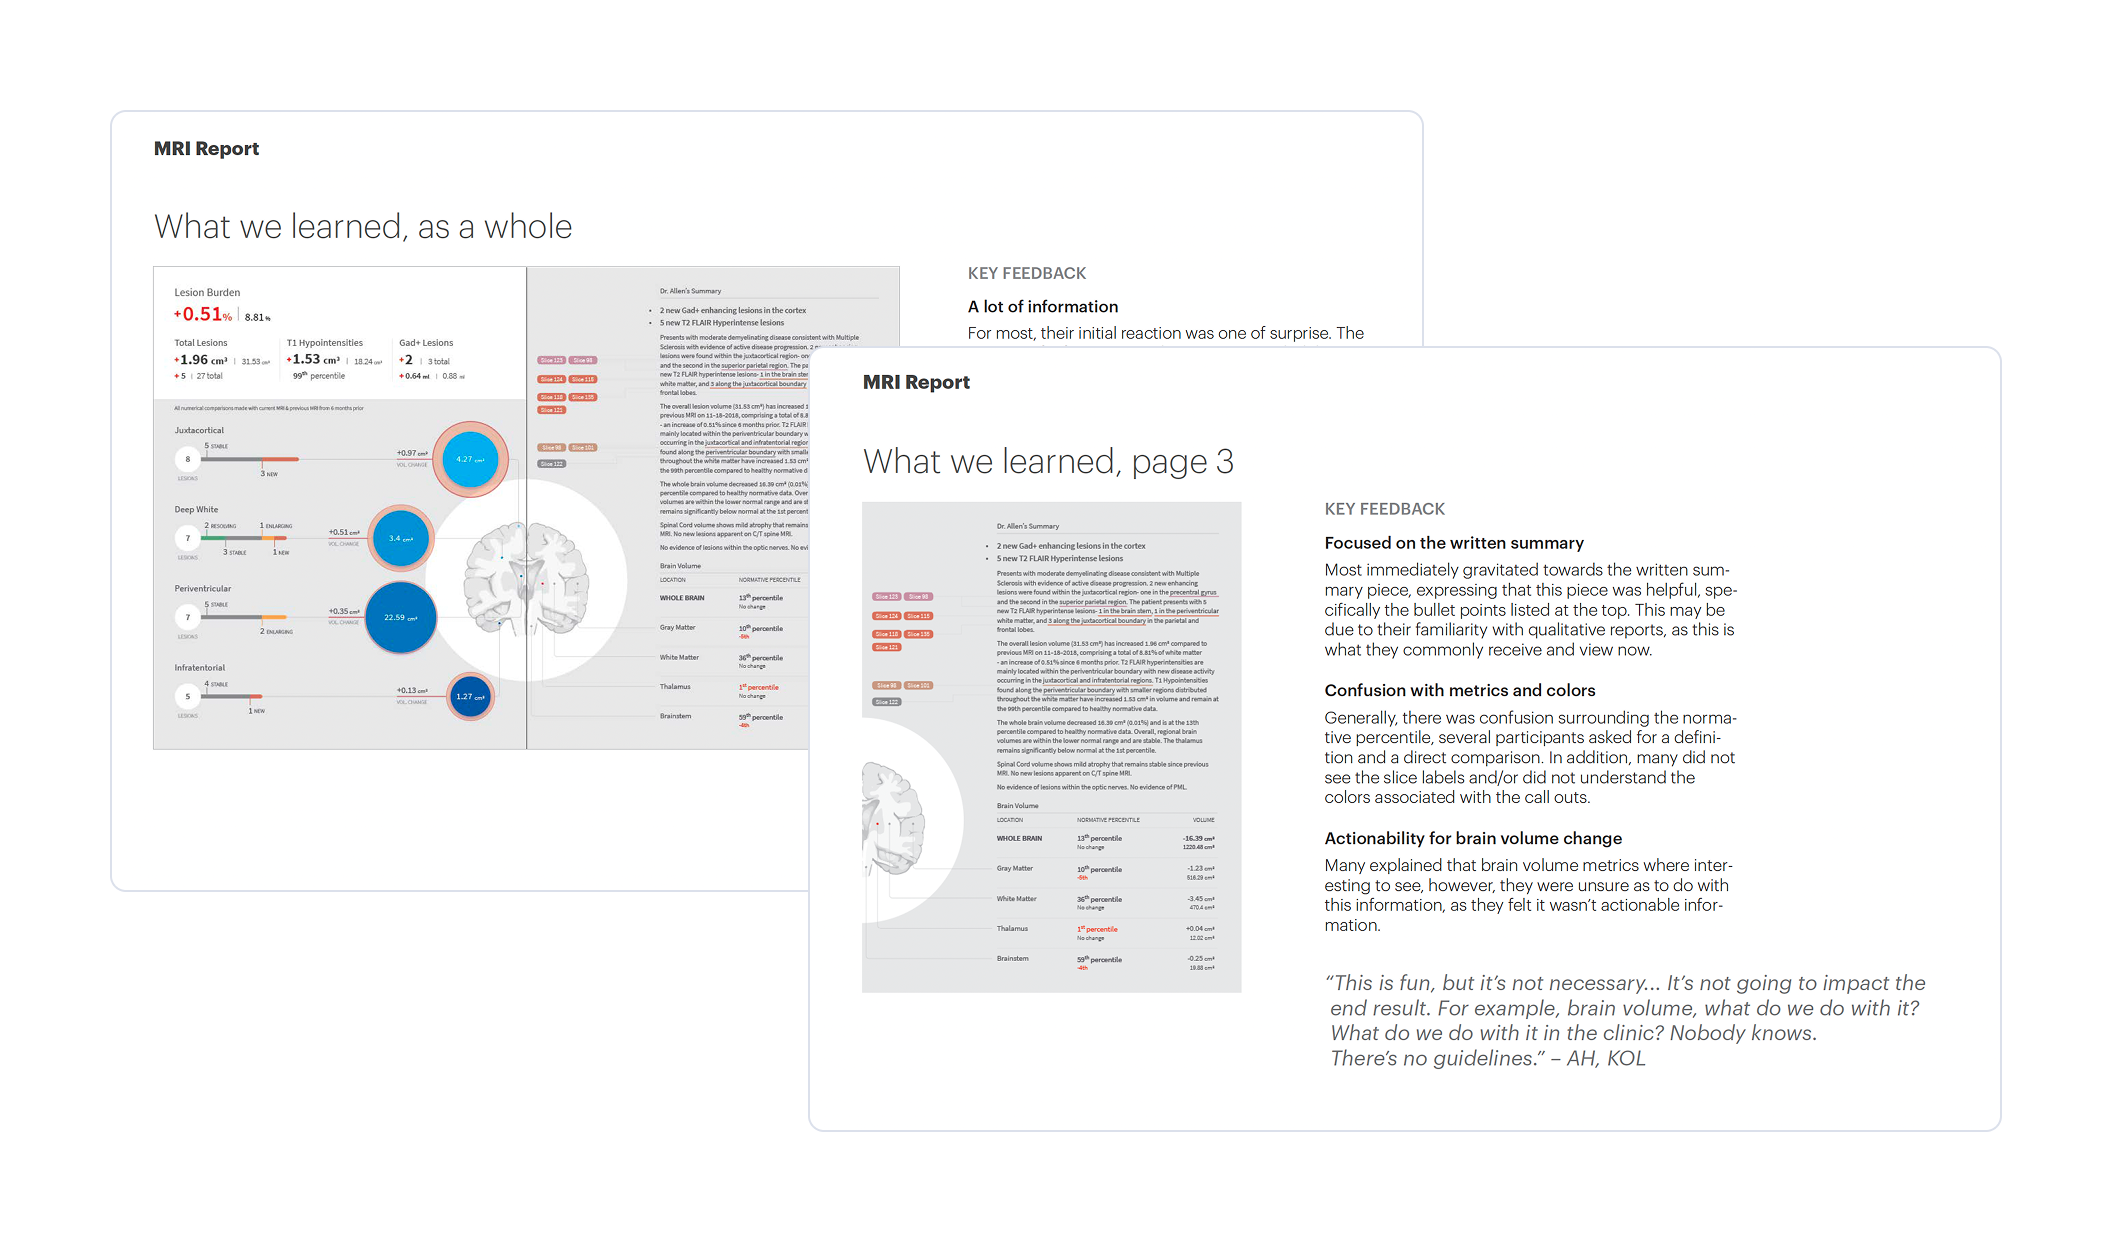
From a report design perspective, I highlighted ways to be more precise and succinct in the data in our report so as to tell a clearer story of the patient’s brain and to potentially condense it into a single page.
Learnings & Takeaways
A tight timeline forced the team to narrow its focus to only what we could learn and act on quickly. Instead of chasing every possible improvement, we made deliberate fast calls about which questions to answer, which hypotheses to test, and which design bets to place. Framing the work around learning rather than perfection gave everyone permission to move forward with imperfect information, adjust as we went, and still make meaningful progress toward a clearer more useful product.
Make space for discomfort when reshaping entrenched workflows
MRI review is a deeply ingrained pattern for neurologists, and introducing new data points into that flow surfaced a predictable mix of curiosity, skepticism, and discomfort. To change a long‑standing behavior, early discomfort is a sign to be managed, not avoided, through better framing, gradual adoption paths, and clear “escape hatches” back to familiar ways of working.
Distill complex outputs down to decision moments
Designing the MRI report showed that complex data only delivers value when it enables quick confident decisions, not when it overwhelms with exhaustive detail. The key is to anchor on the core decision or action it must unblock, then work backward to the minimum information and framing actually needed to make that call.
Other Projects
Healthcare • 0–to–1 • Mobile/Service Design • B2B2C
Building the First Offering for a Health Platform for MS Patients
Data Storage • Dashboard • B2B
Unifying SMB Products into an Enterprise Storage Platform

Human Resources • Service Design • B2B