Storage Monitoring for Enterprise Scale
I led design across four workstreams, with my primary focus on defining a platform vision that unified monitoring across two flagship products into a single consolidated experience. After presenting this vision to the C-suite and securing funding, I then partnered with the development team to build and pilot key aspects of the vision for enterprise customers.
Project
Platform Design
Role
Lead Designer
Year
2023-2024
Scope
Dashboard
User Research
Information Architecture
Workshop Design
THE ASK
A leading data storage company that sold and leased storage arrays had traditionally focused on SMB customers was successfully transitioning into the Enterprise space with increased sales. However, the needs of those enterprise customers were not entirely met in the 2 flagship products used to manage their storage infrastructure due to their much larger scale and deeply connected arrays that were distinct from SMB customers.
Furthermore, over the years, there was greater overlap between the 2 flagship products to the point where it was confusing for customers to understand how they were similar or different from each other. I was tasked to figure out how to position them for the enterprise customer that was using both products.
BUSINESS CONTEXT
Design an enterprise monitoring vision that unifies two existing storage products into a cohesive platform experience to enable storage admins to seamlessly manage 100 arrays, scaling the current experience that was designed for 10 arrays by 10x.
Outcomes
The original ask for this project was to create a 2-3 year platform vision. However, the vision resonated with customers, internal stakeholders and senior leadership so we received funding to build a pilot to test with enterprise customers.
The enterprise customers on the pilot responded well to the new large fleet monitoring capability that was only a facet of the vision.
USER FEEDBACK
+45%
confidence in managing large fleets of arrays (>50 arrays) from user testing.
PILOT CUSTOMER SURVEY
4.2/5
on keeping the pilot features to manage large fleets of arrays
USER FEEDBACK
+24%
reduction in time to identify and know how to resolve the simulated storage issue
BEHAVIORAL ANALYTICS
1st
most used feature after landing on the home page
1 Understand Enterprise User Needs
2 Visualize the Storage Infrastructure
3 Unifying the 2 Products
4 Translating to Production
Enterprise customers weren’t using the existing fleet monitoring page, so the goal was to understand why and learn what they actually needed. Conversations with internal stakeholders helped round this out by clarifying what had already been tried and where those prior approaches had fallen short.
Audit on Current Products
I worked with another Product Designer to conduct the audit across both of the products to understand how fleet monitoring wasn’t working from monitoring to investigation.
The audit made it clear that the current designs were designed for a small scale, had a fragmented experience, and had analytics that were too high-level or too detailed.

Although Array Cards were a solid modular pattern, they clearly did not scale to showing 100 arrays on a single page, and customers could only infer relationships between arrays from their names, which were visually small.
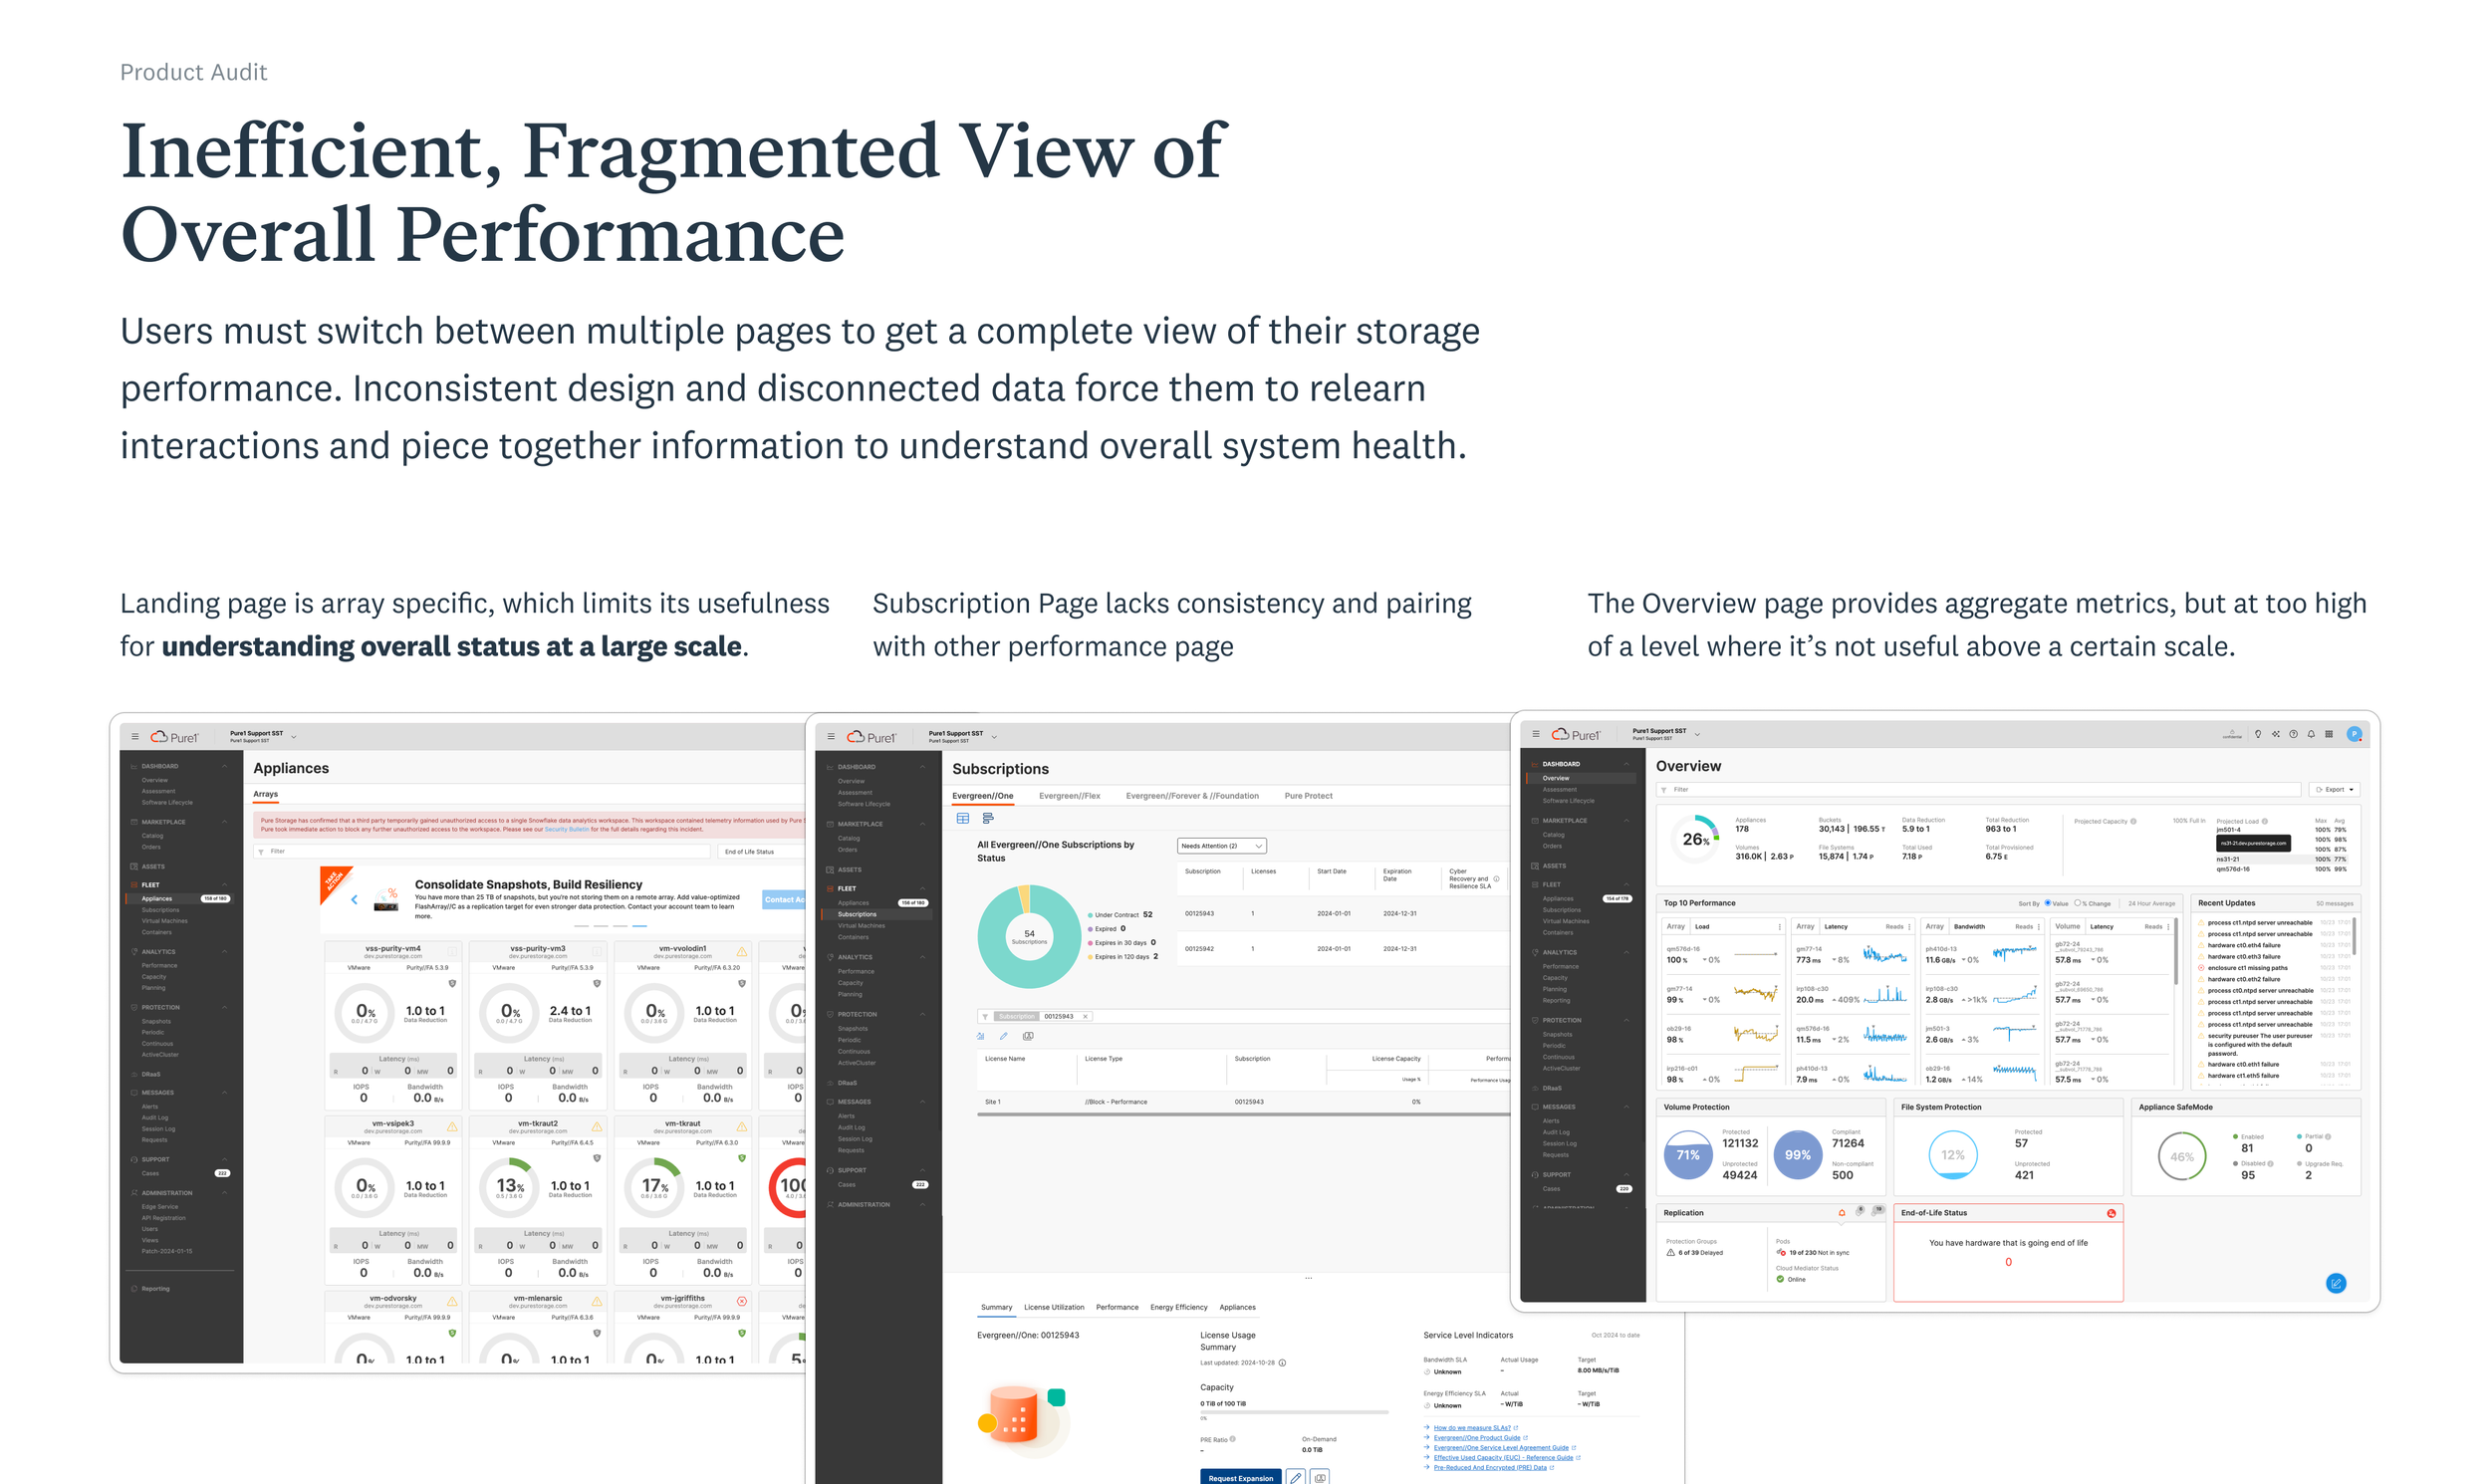
There was no central view of fleet health; customers either saw per‑array “Array Cards” or high-level stats like total capacity, which was not useful once they were managing more than 30 arrays. They also lacked continuity being on different pages.
I then ran in-depth interviews with five storage admins and three solution architects from enterprise companies and asked them to walk through how they monitored their storage infrastructure across the two existing products.
User Research on Enterprise Customers
CUSTOMER GOALS
What were users trying to understand about their storage infrastructure when looking across their fleet of arrays?
What use cases were essential for customers for the monitoring view? Was it just for them or for other types of users?
PRODUCT REQUIREMENTS
How were storage admins using the two products differently to manage their fleet of arrays, and the mental models when doing it?
In what ways were the current products inadequate in serving their needs? What made them unique to their enterprise needs?
CUSTOMER INSIGHTS
“I look for outliers but across different lenses like capacity, performance, and others but the process is very manual.”
Customers wanted a holistic view of their storage arrays where they didn’t need to piece things together array by array but could look across all of them.
“In a crisis, I need to show my peers in Compute and others that storage is not the issue but it’s hard to use CLI or tables.”
Desire for visualizations of the storage infrastructure to prove in ‘live’ investigations with their technical peers that storage was not the root cause.
PRODUCT(S) INSIGHTS
“There’s great monitoring data in the products but it’s just too much. If I need more than 30s to make sense of it, I skip it.”
Users trusted the data in the products but desired for curation to see data at the right level of zoom similar to their mental model of country, region, etc.
“I’m forced to use both products as fleet monitoring and array management are in separate products.”
Preference to do it all within a single place or platform for an end-to-end monitoring & investigation experience to reduce losing context.
1 Understand Enterprise User Needs
2 Visualize the Storage Infrastructure
3 Unifying the 2 Products
4 Translating to Production
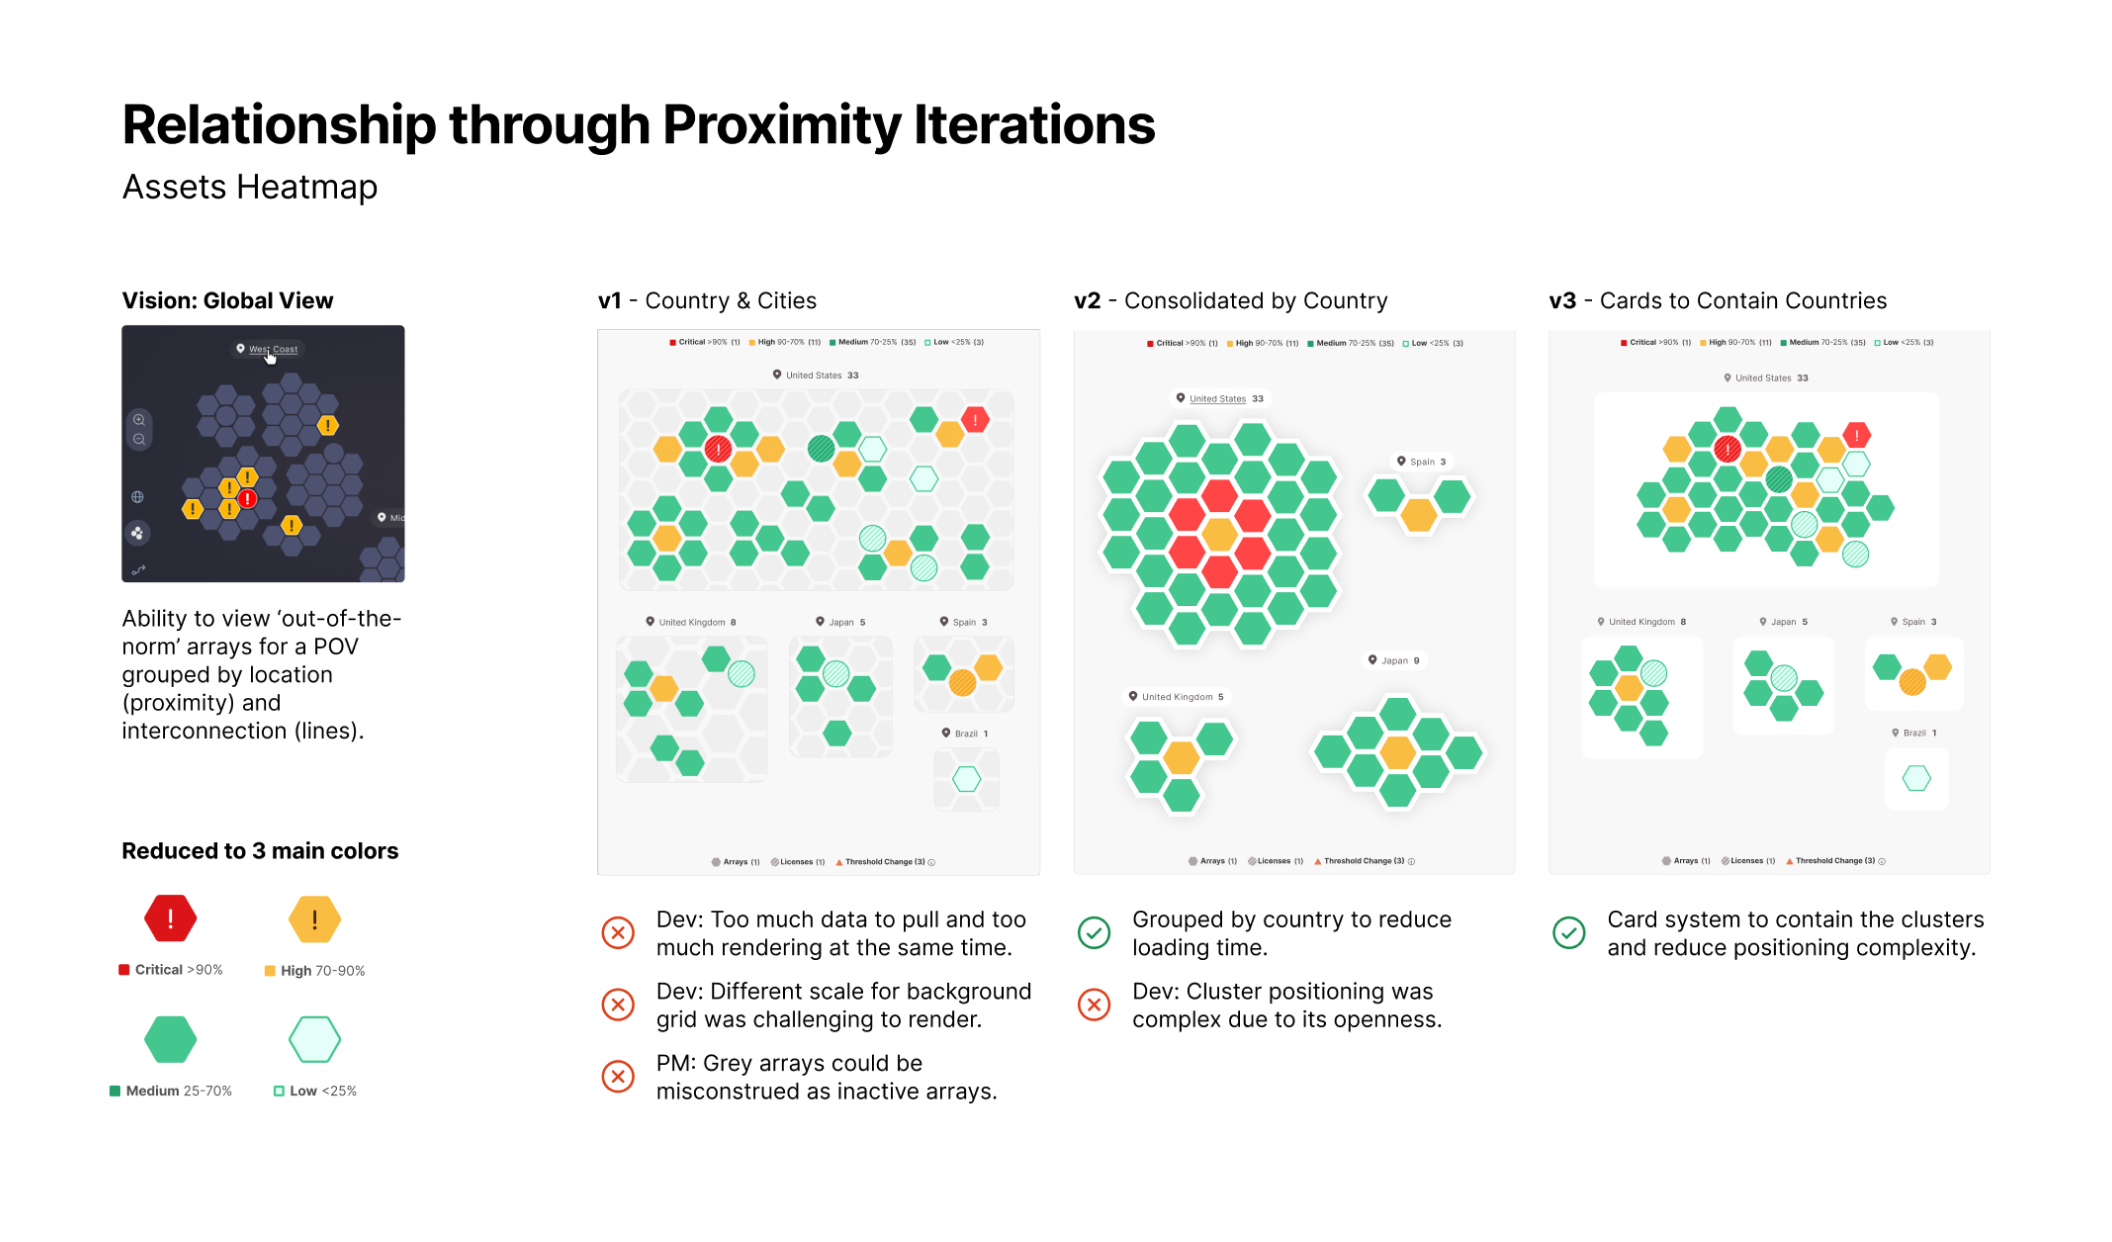
Enterprise customers needed a central place to view their fleet of arrays holistically so I explored visualizations of array relationships & concepts on how to use the different lenses to find outliers in their fleet.
Providing an Overview and Relationships
I started with visualizations of the arrays first as it was a more constrained data visualization exploration and it could help jumpstart conversations with the PMs on the types of relationships we needed to showcase.
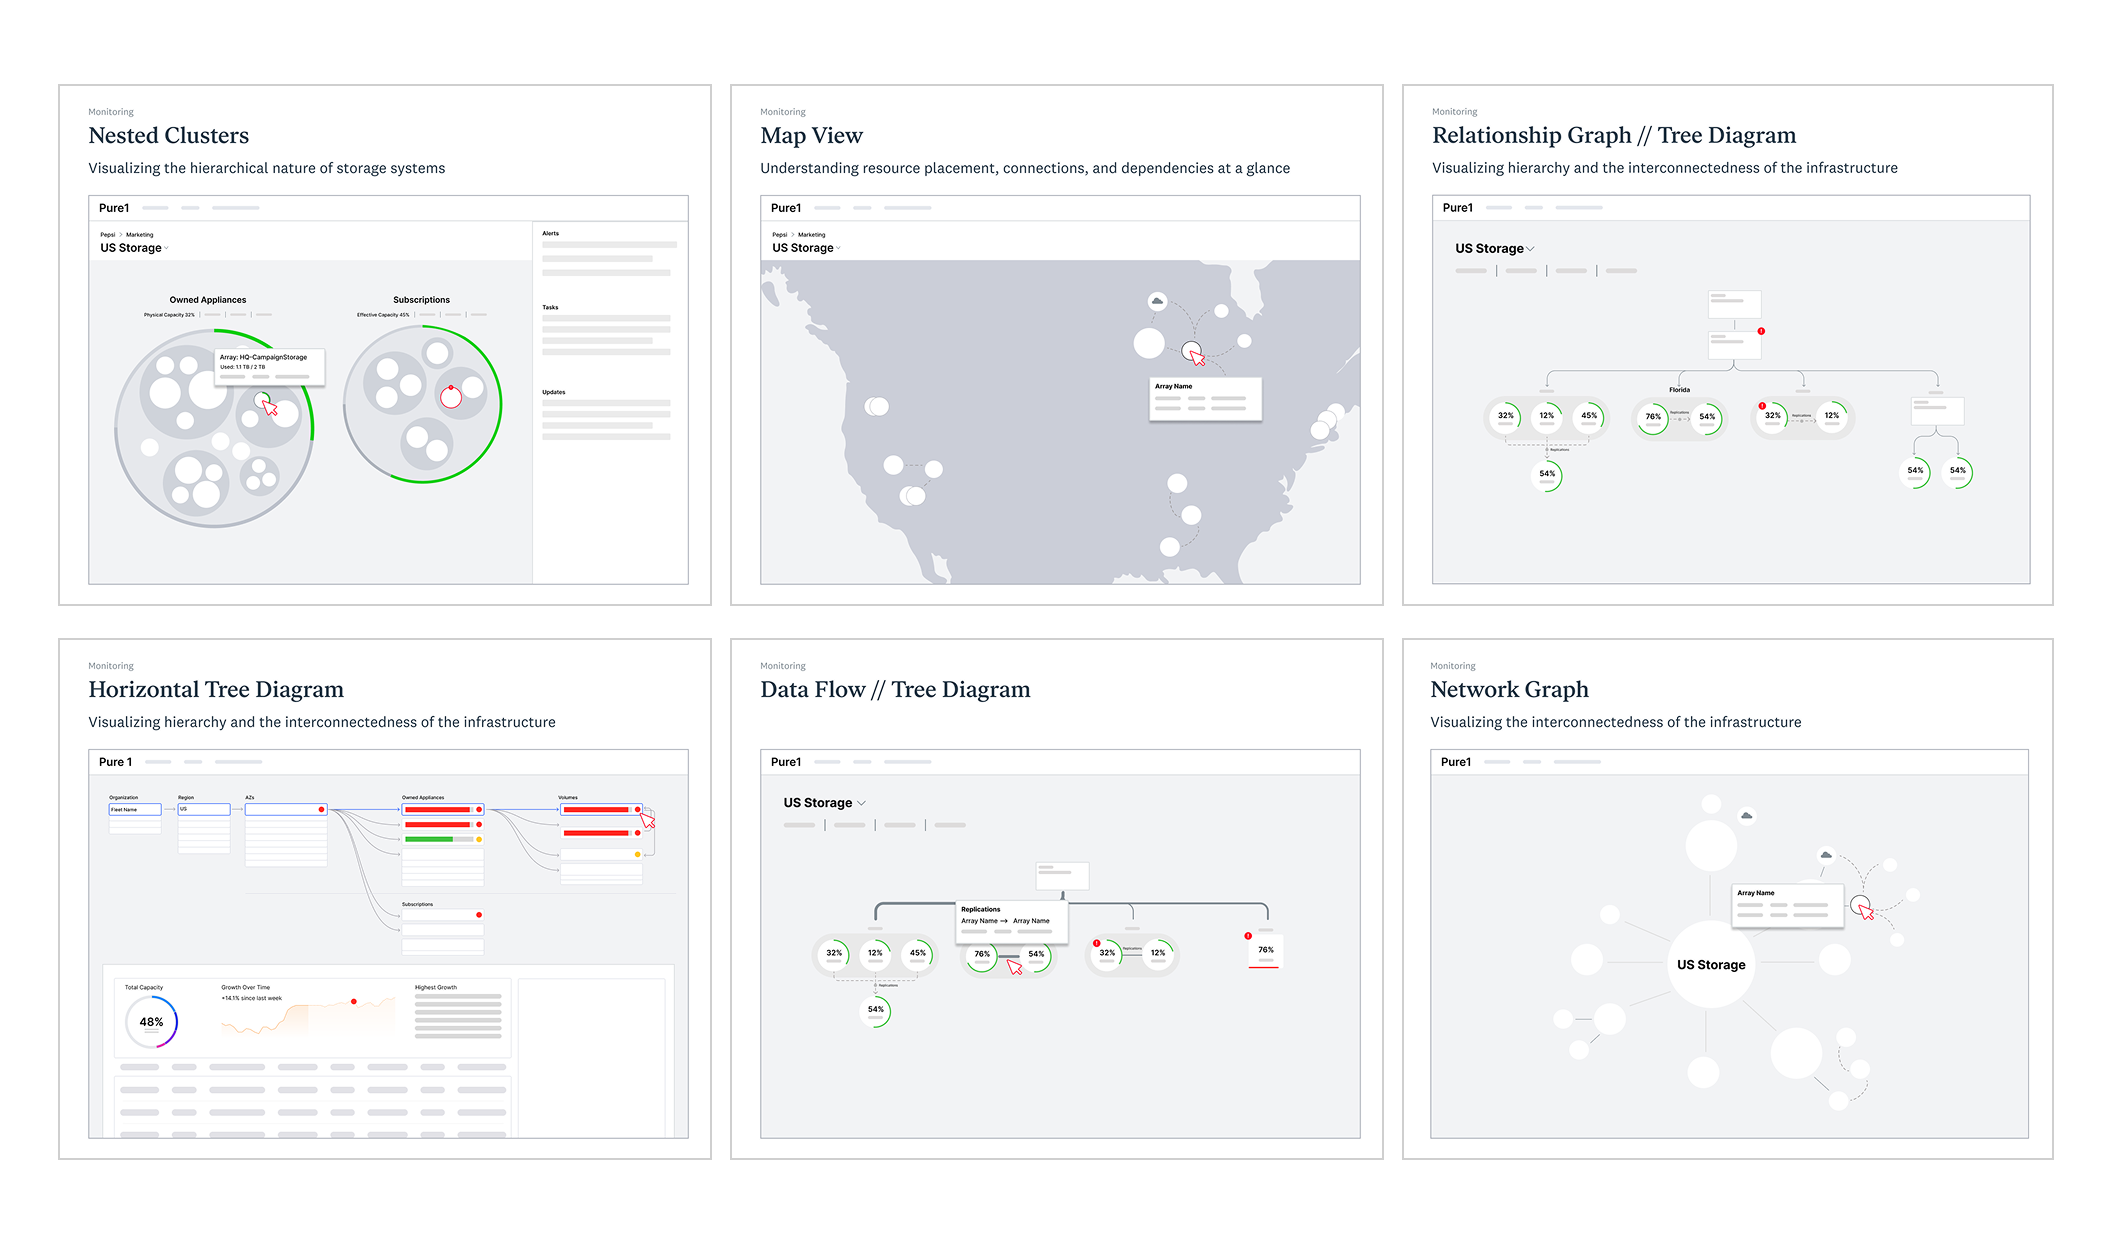
Explored visualizations for array relationships first such as nested clusters for hierarchy, tree diagrams for structure, and data flow for interconnections to jumpstart conversations with PMs on the important relationships to showcase.
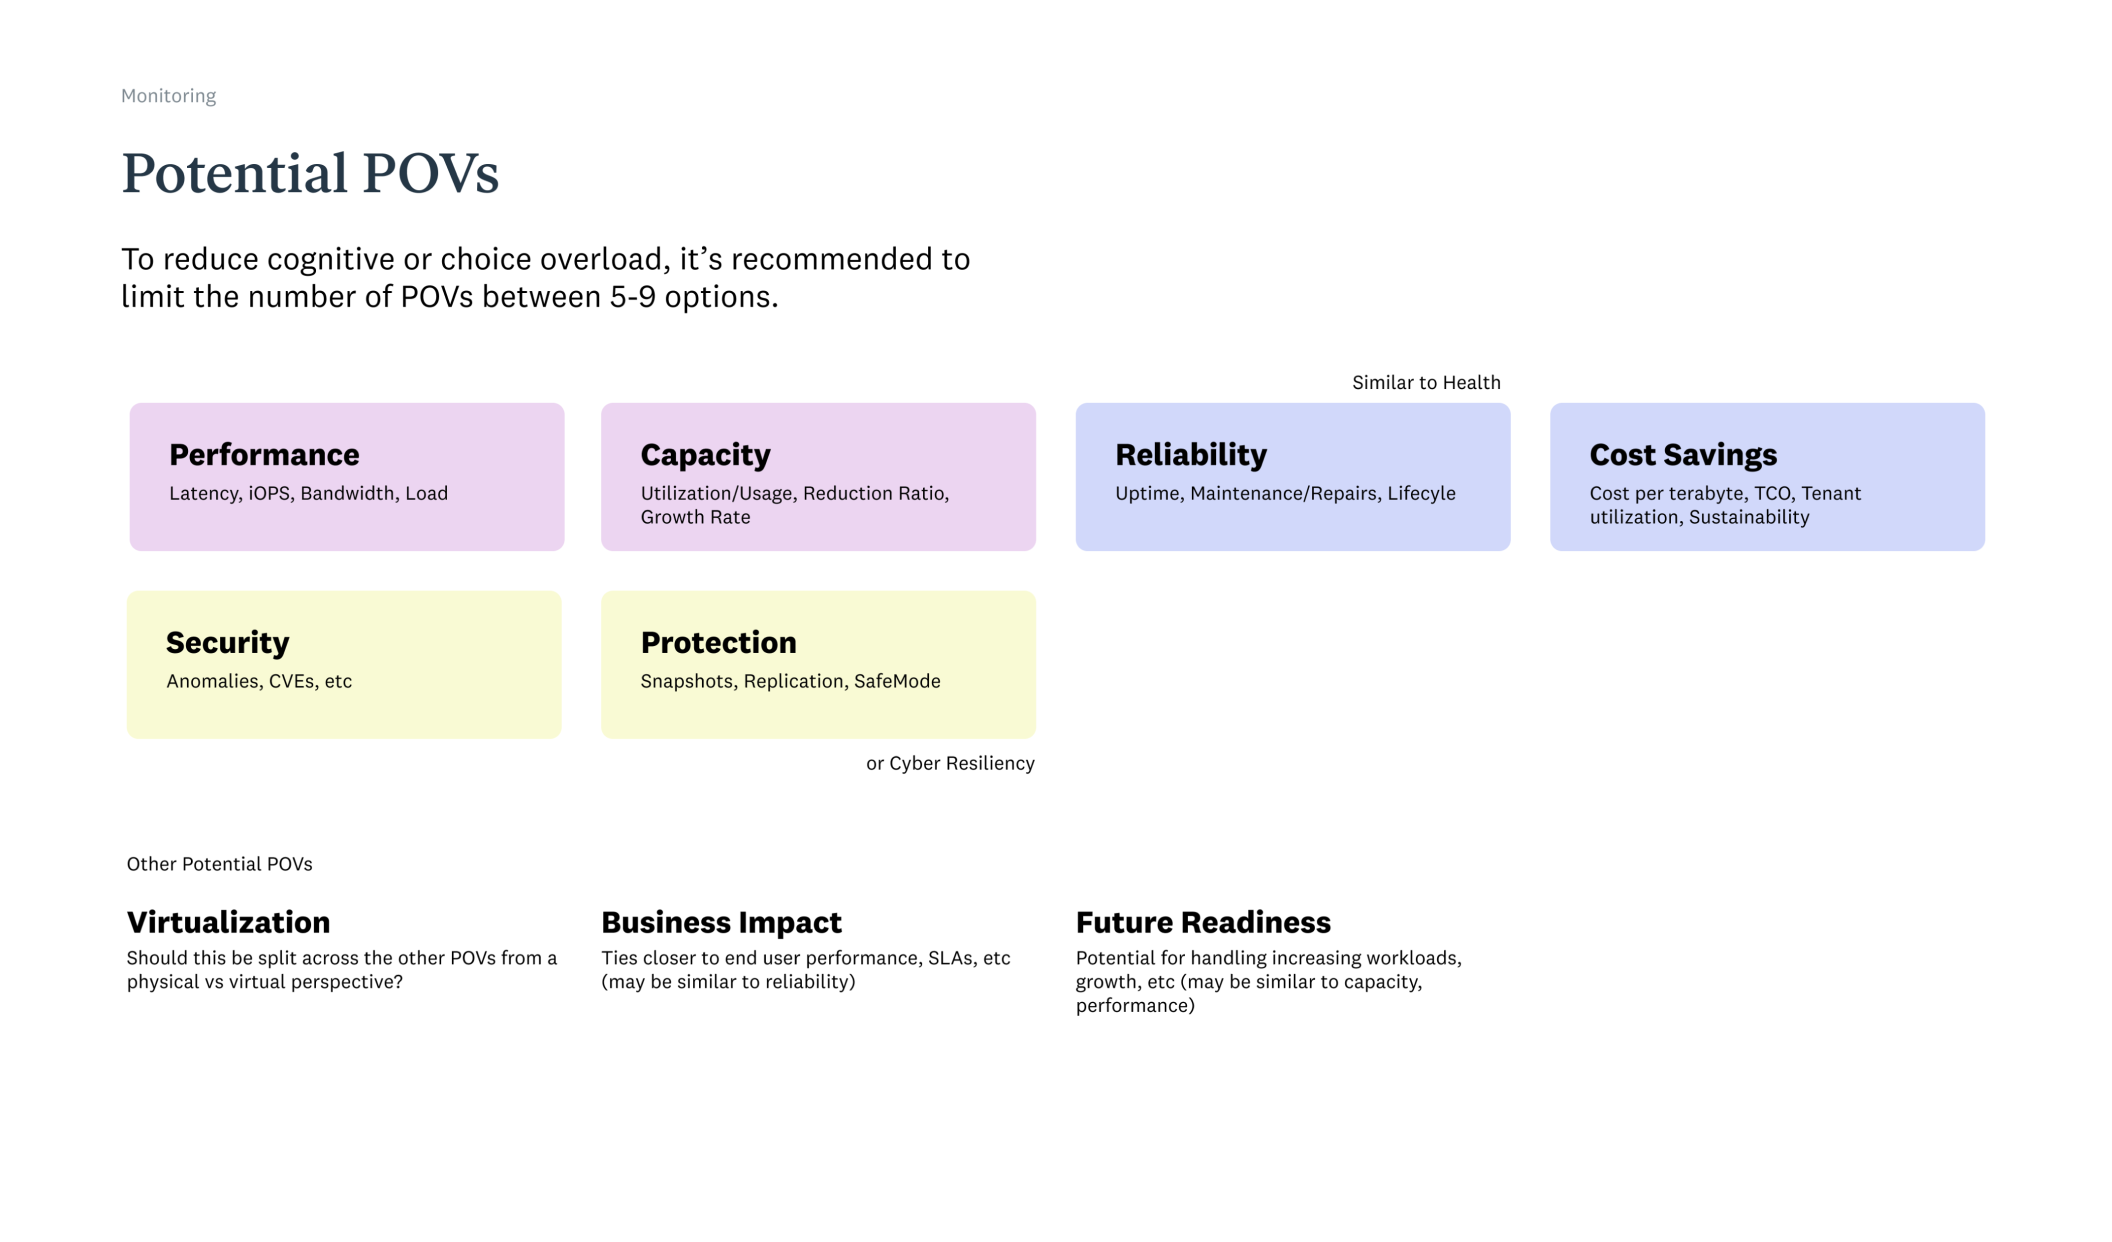
As users had asked for a holistic view across their 100 arrays to find the outliers. I built upon an internal early concept that came up in stakeholder interviews called Points of View to view all their 100 arrays through that lens and to combine this concept with the visualizations.
Combining the Visualizations and Points of View (POV)
It was the combination of being able to view their fleet of arrays through the different lenses that could make this view powerful for the enterprise customers.
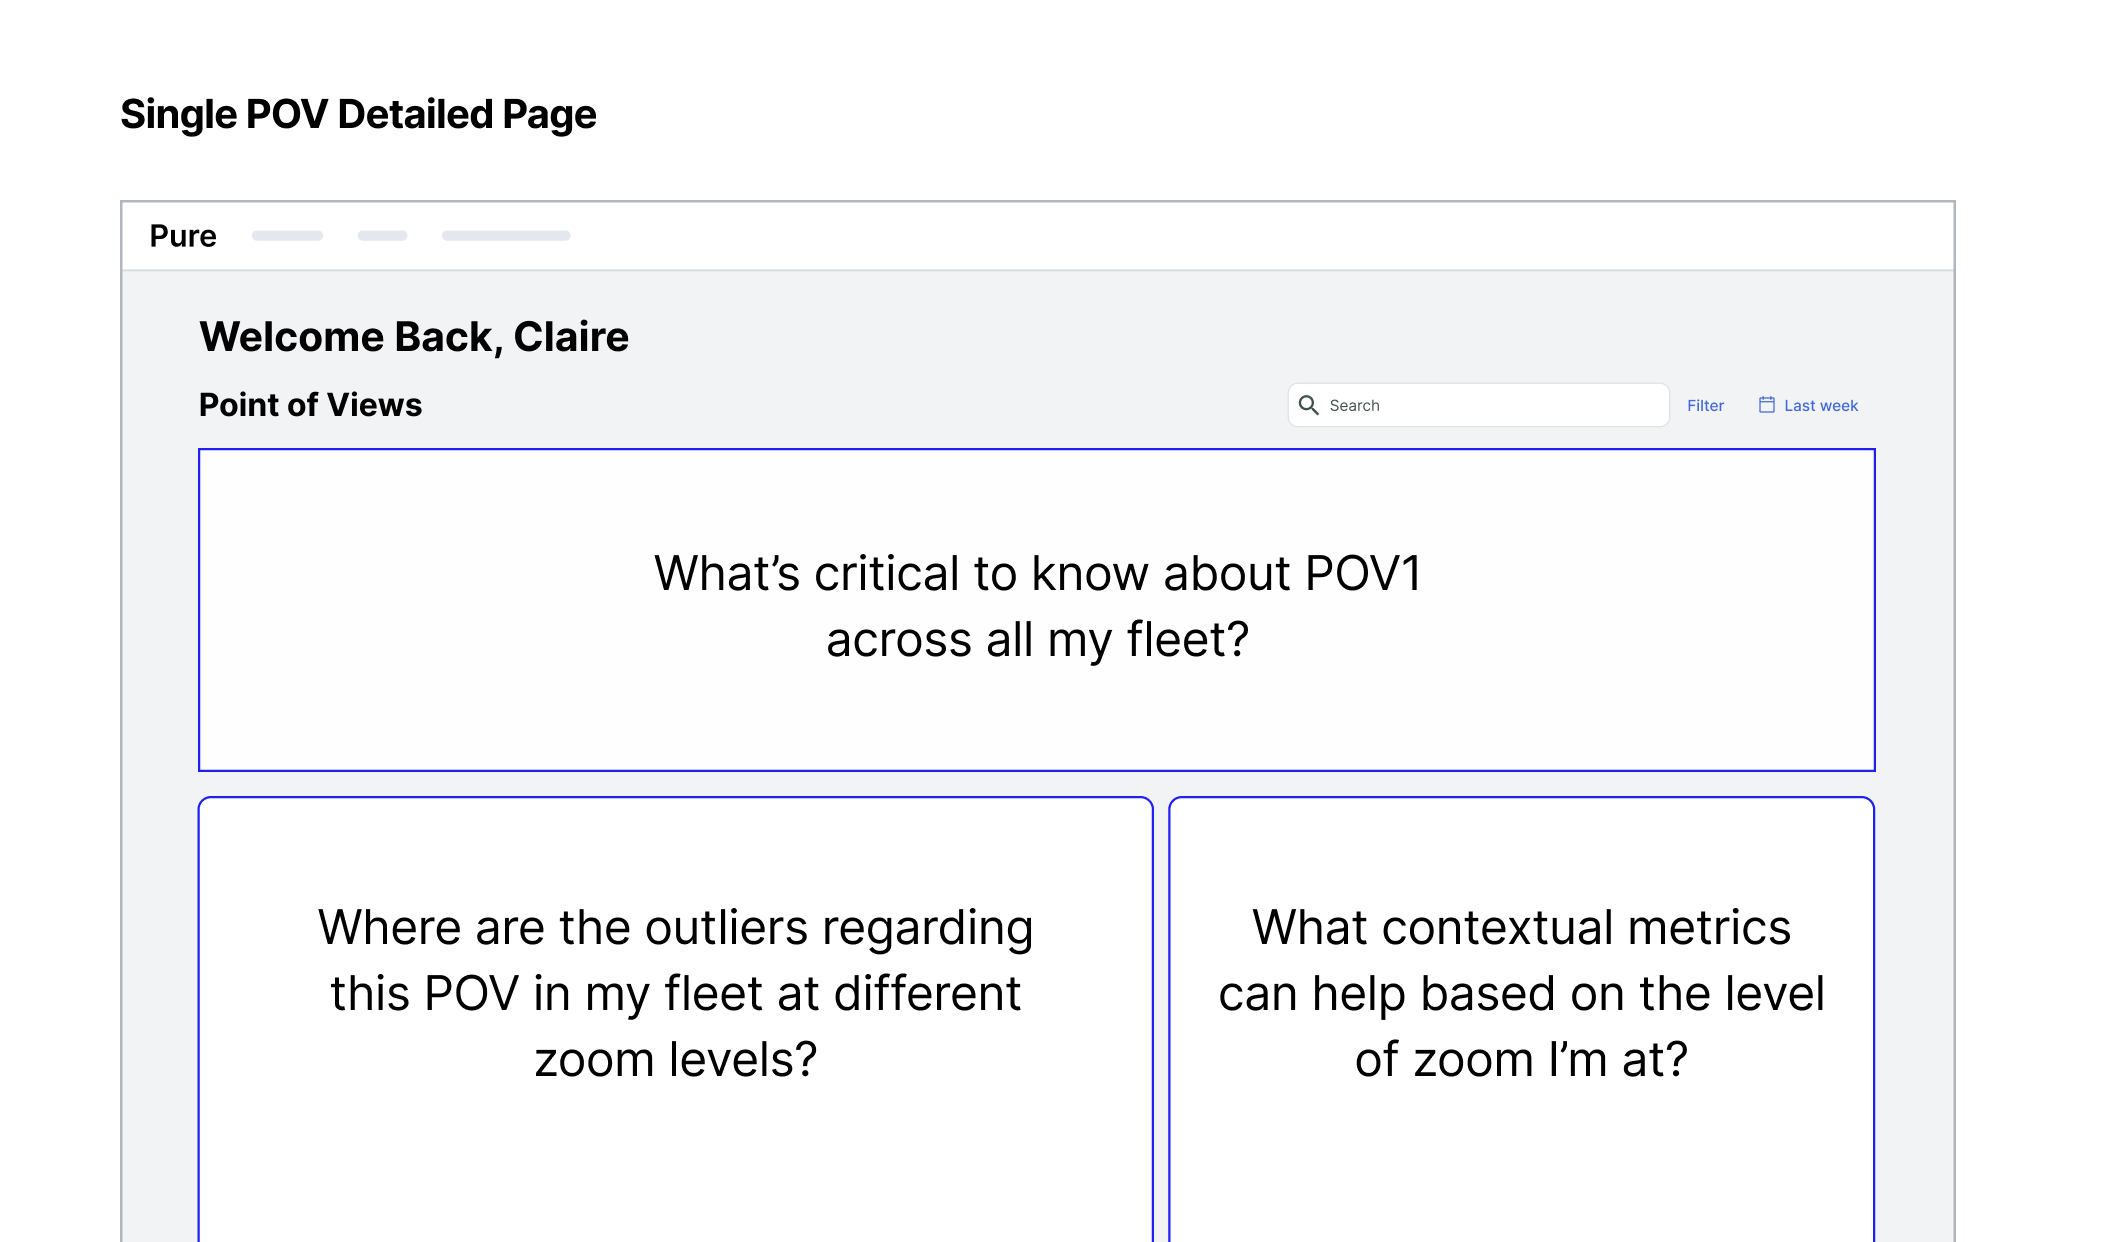
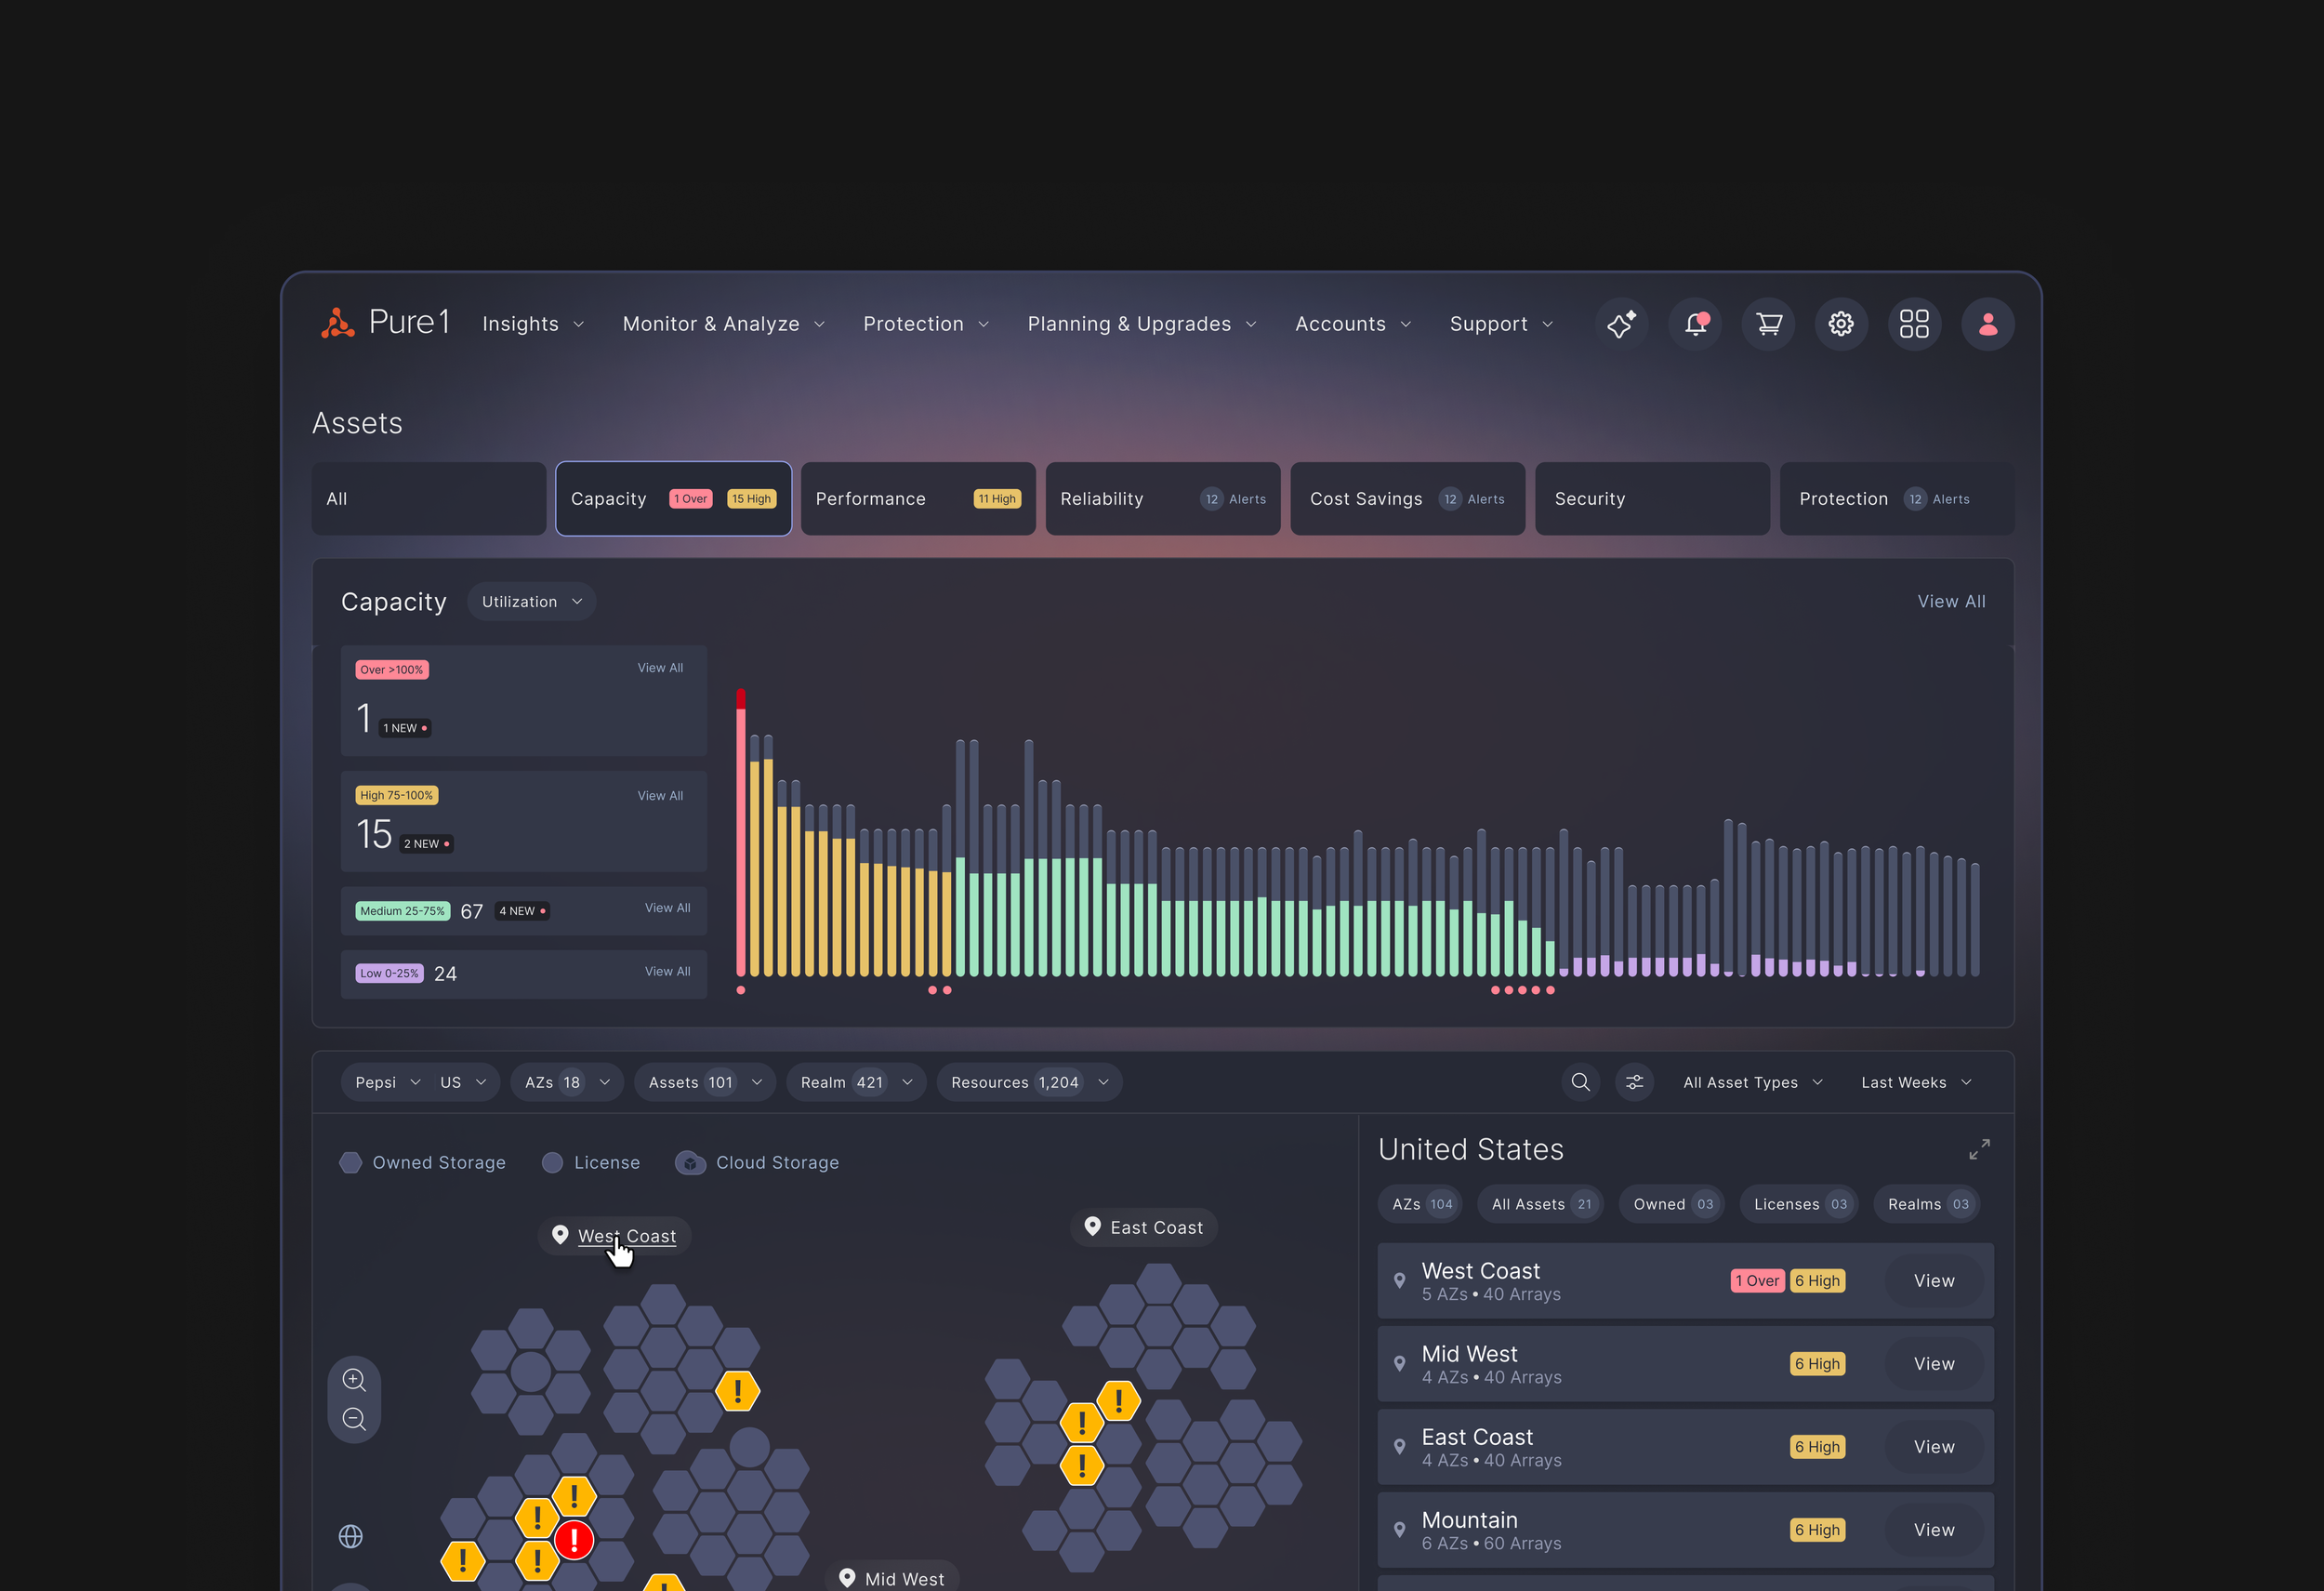
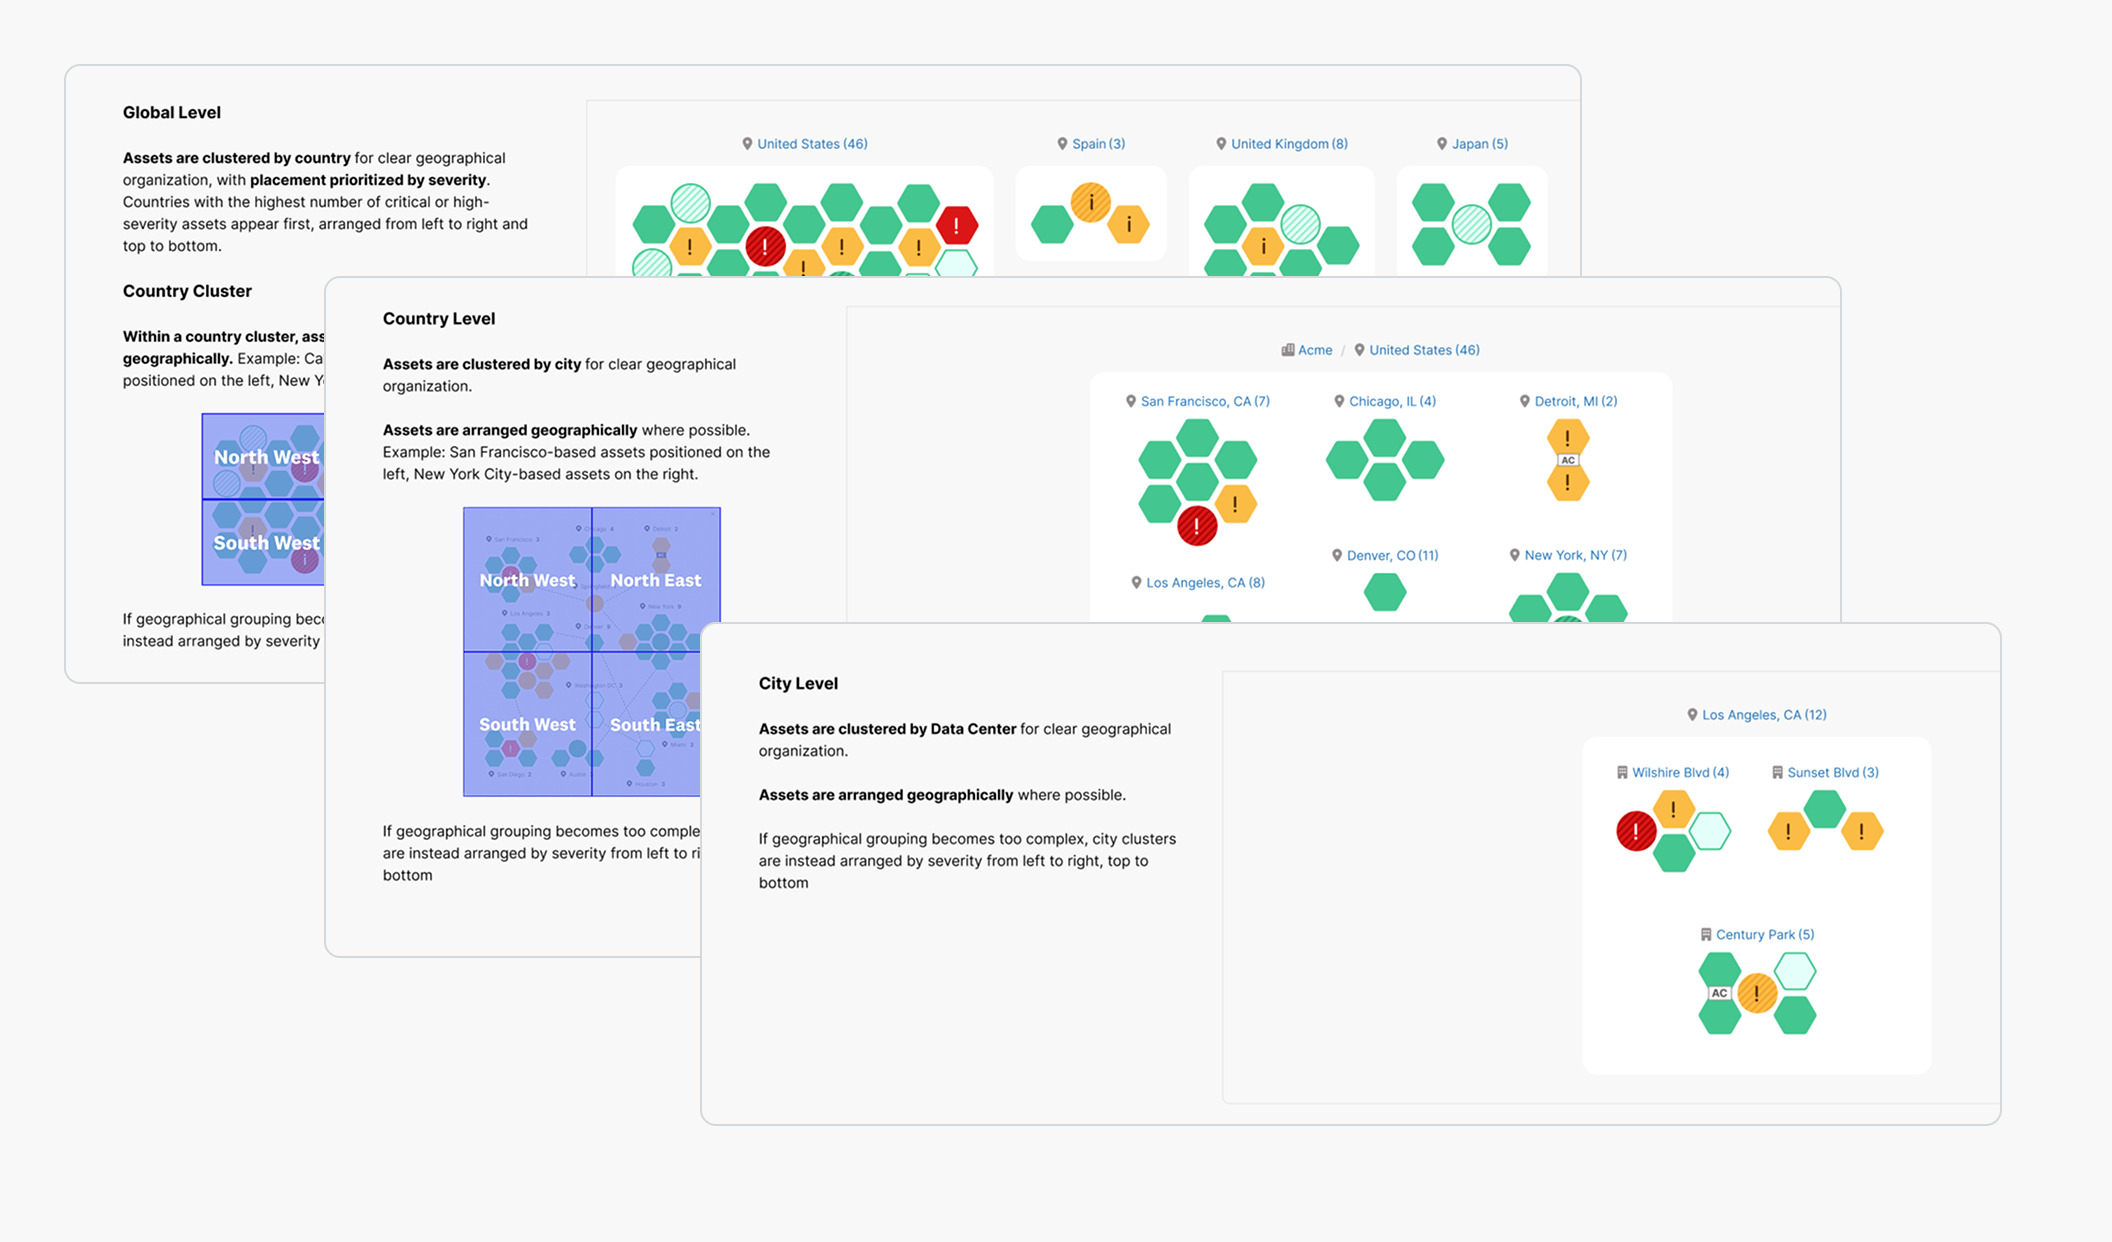
With users wanting to be able to see across their fleet but also be able to zoom in with the right level of metrics for context. I struck a balance between the three key needs or questions in their heads.
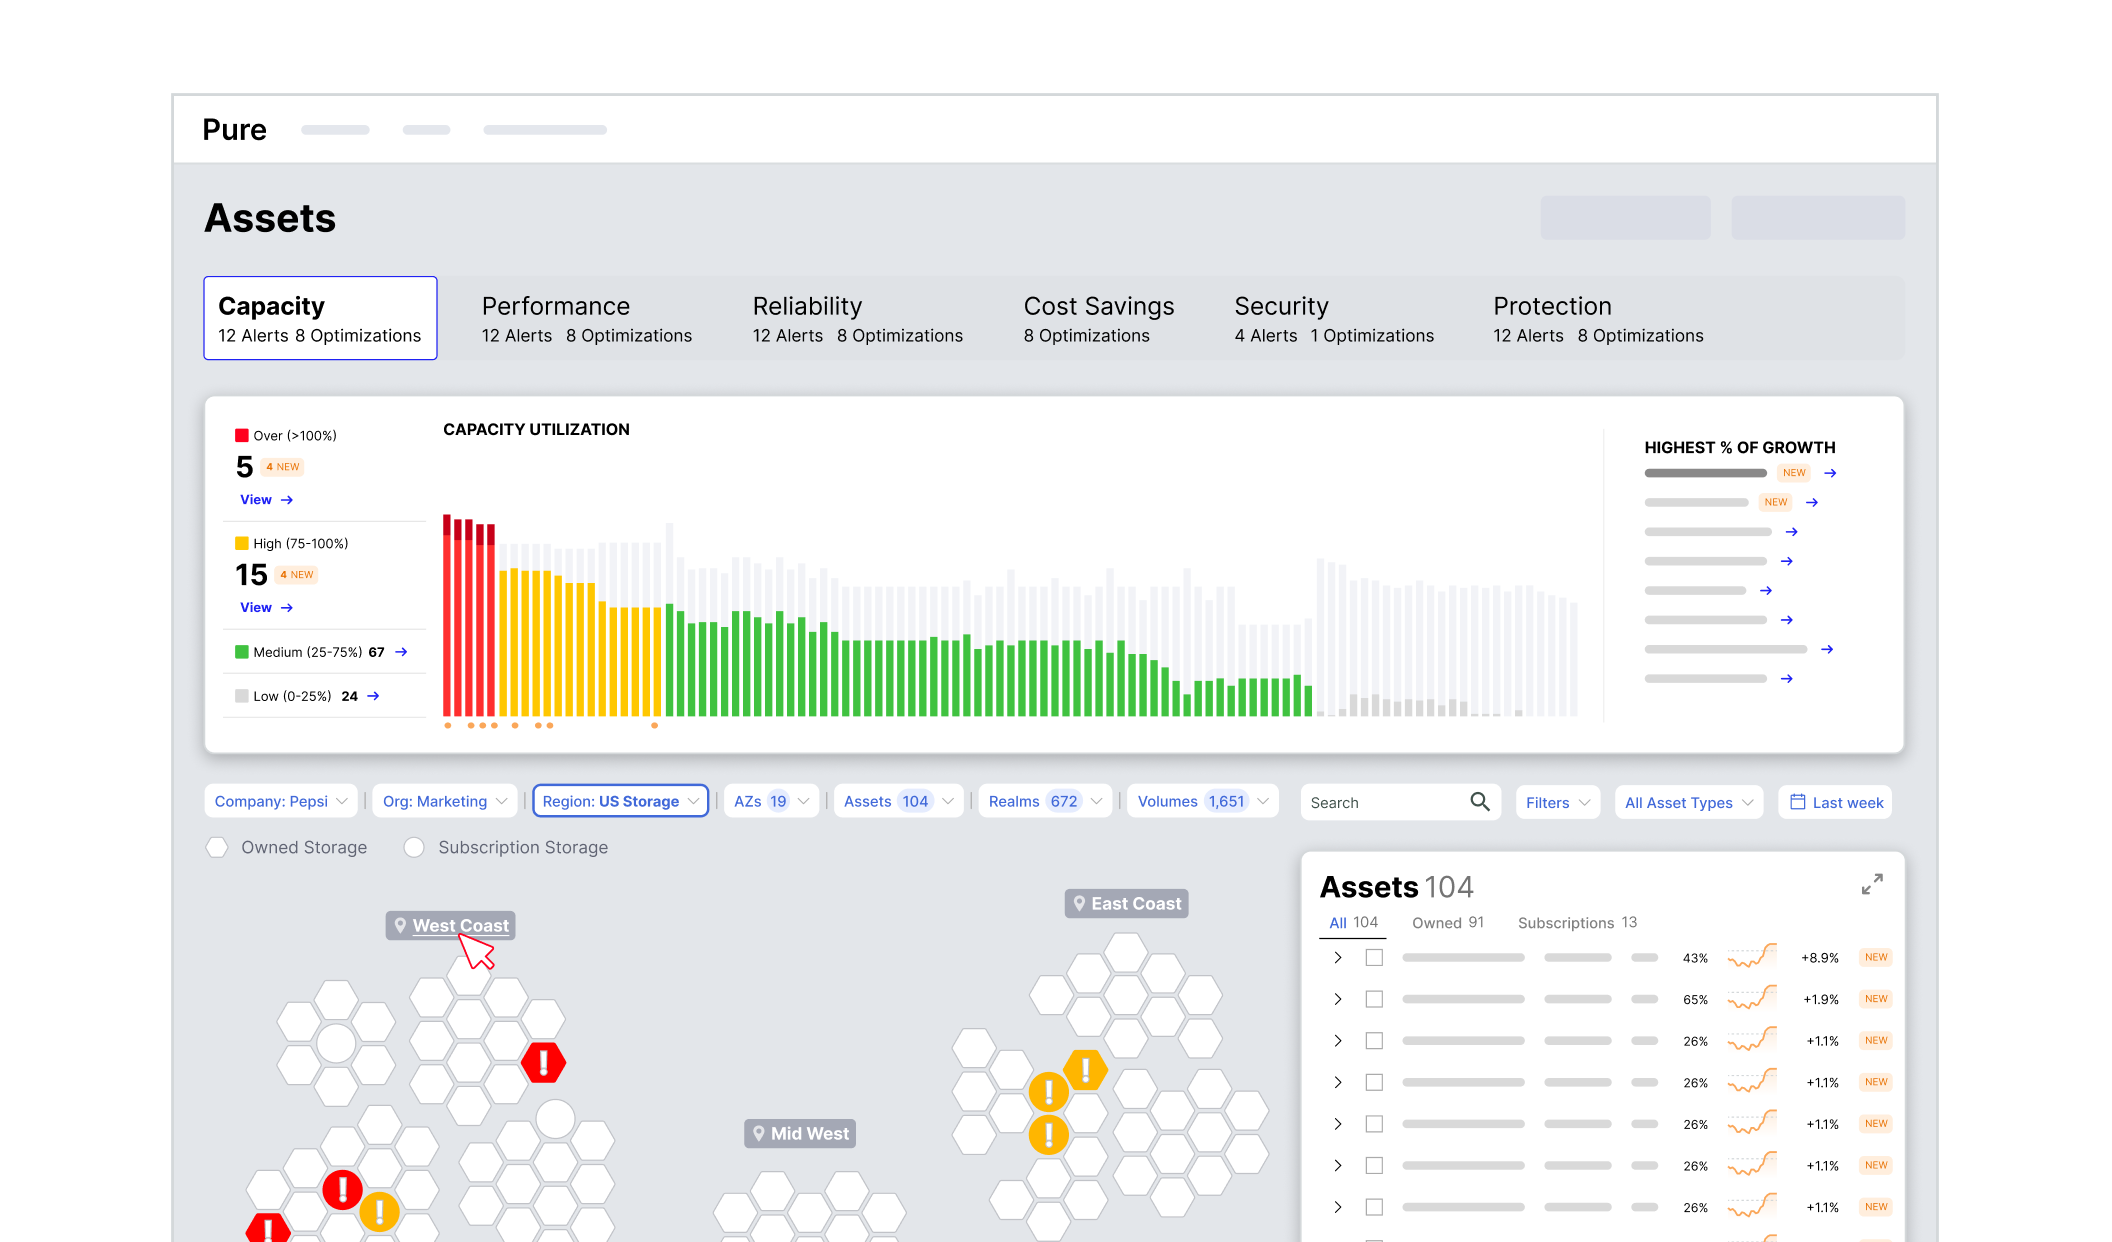
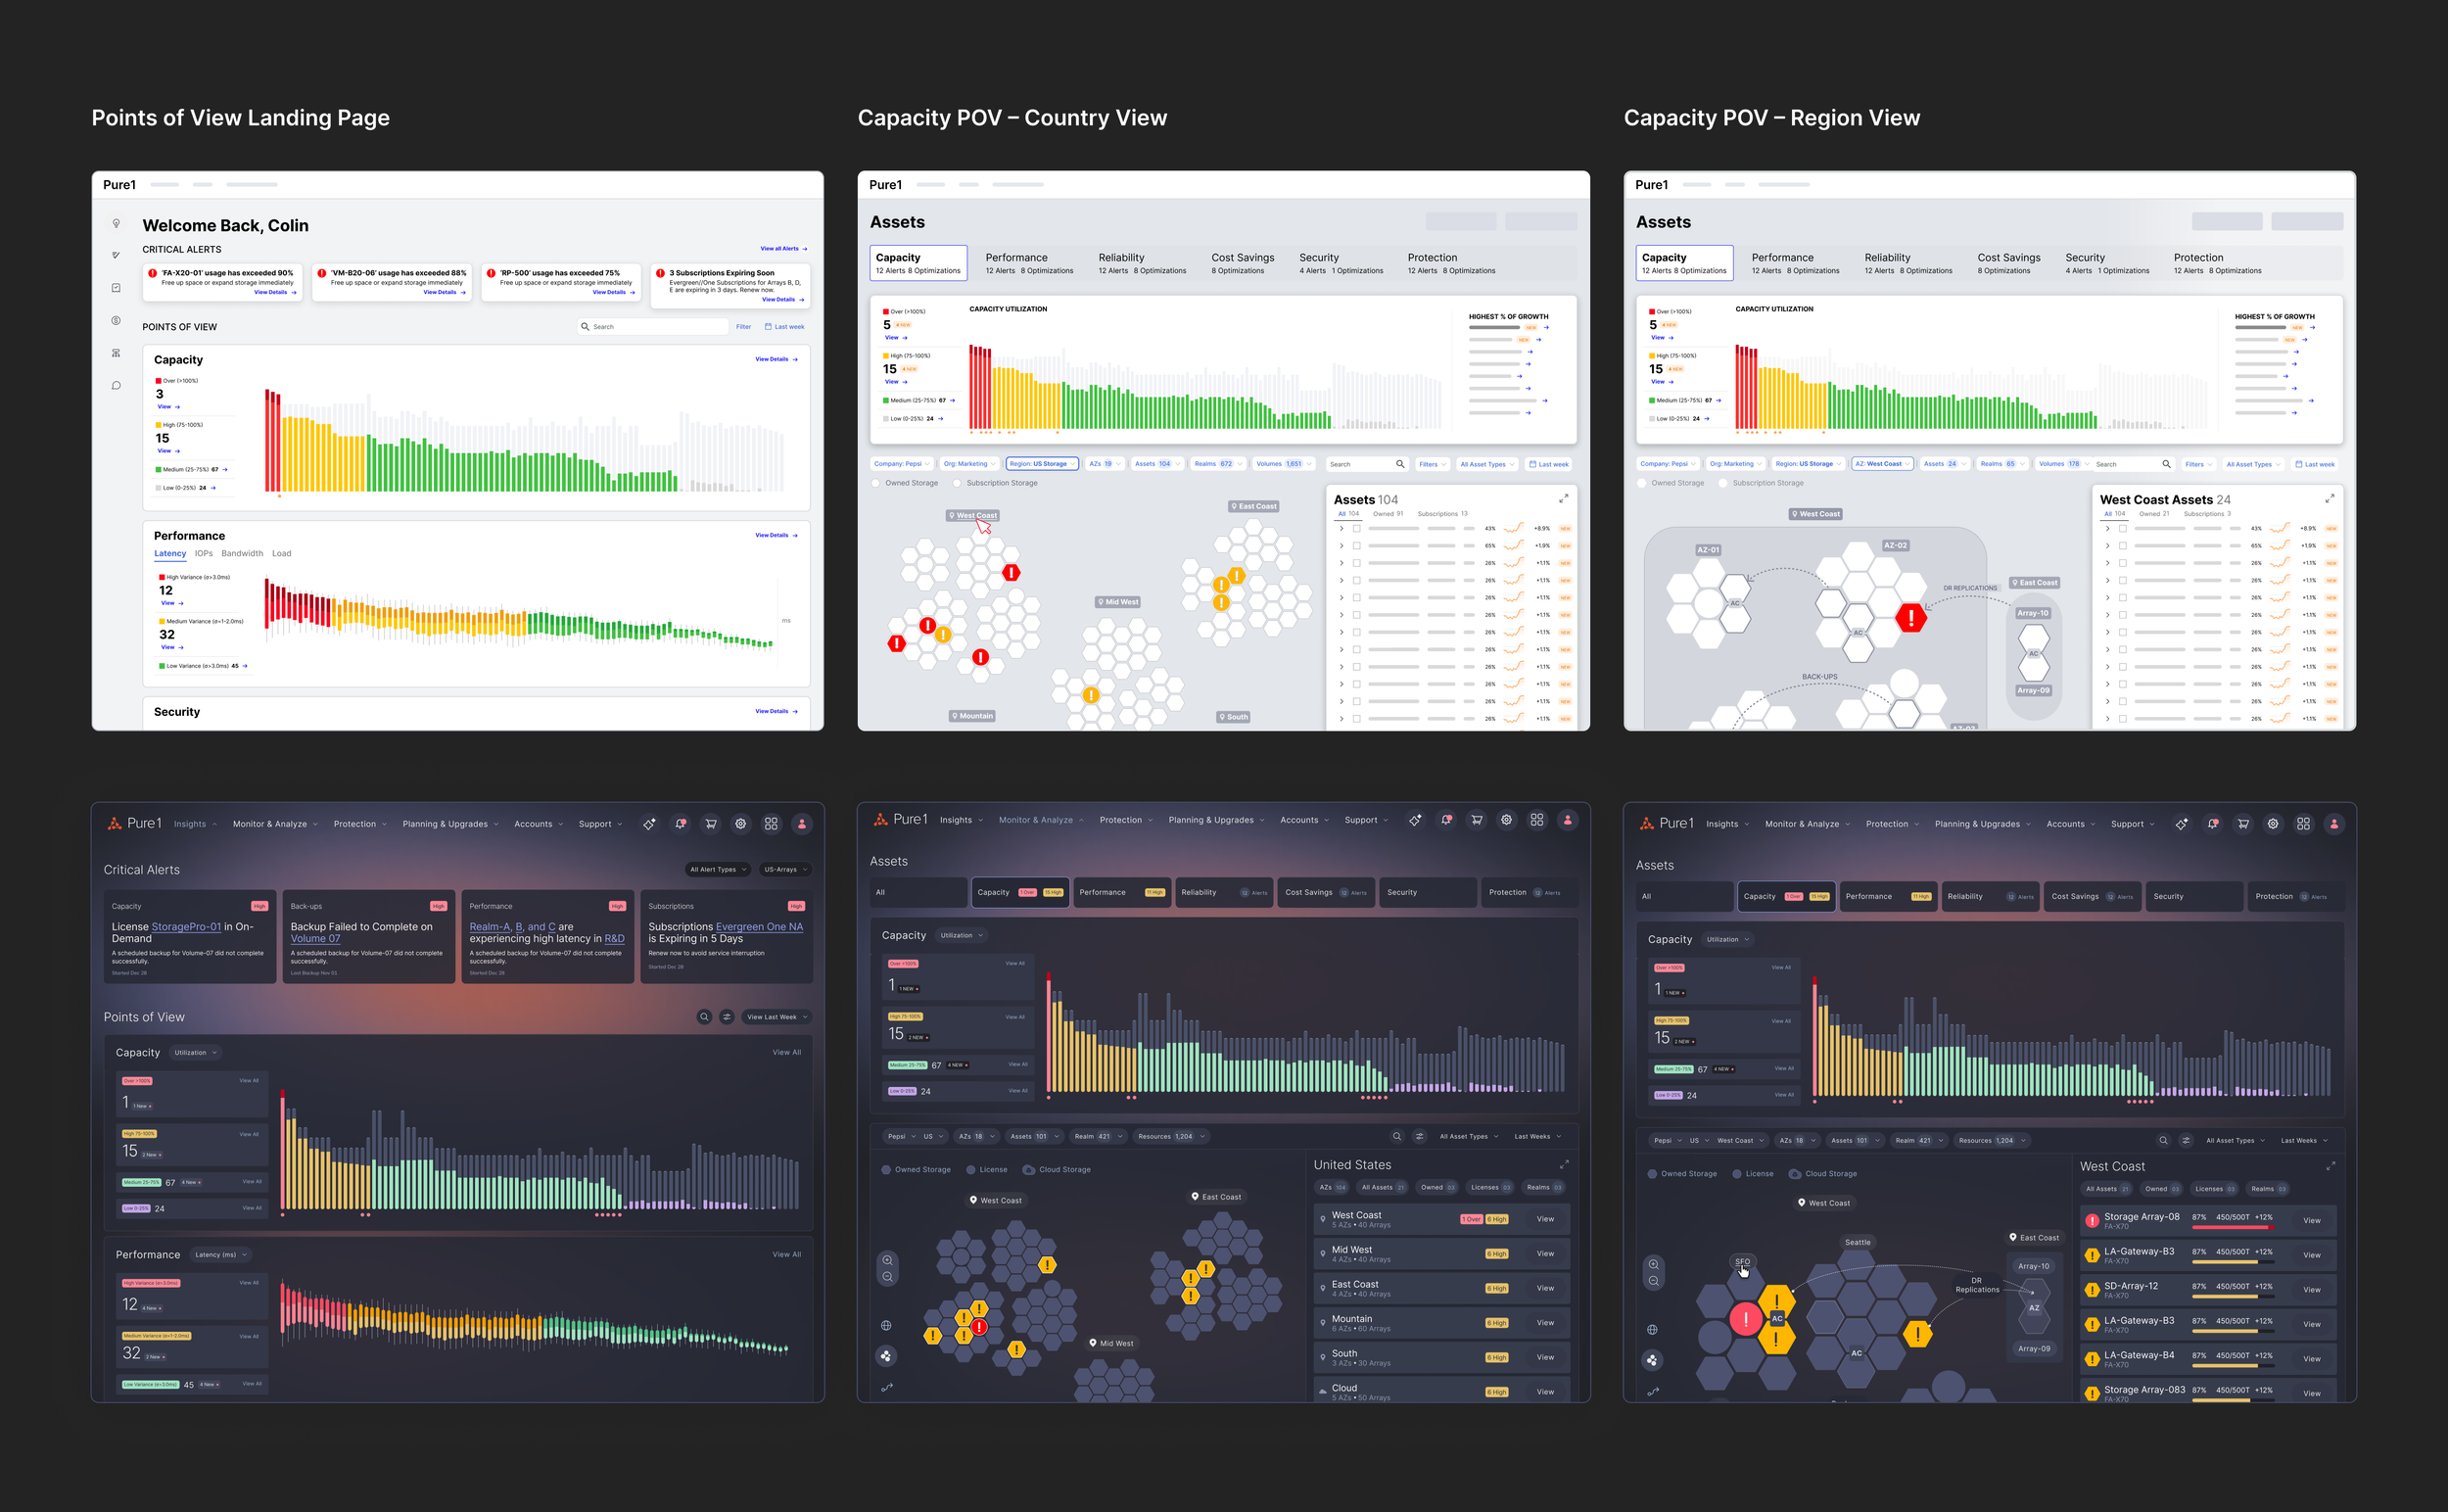
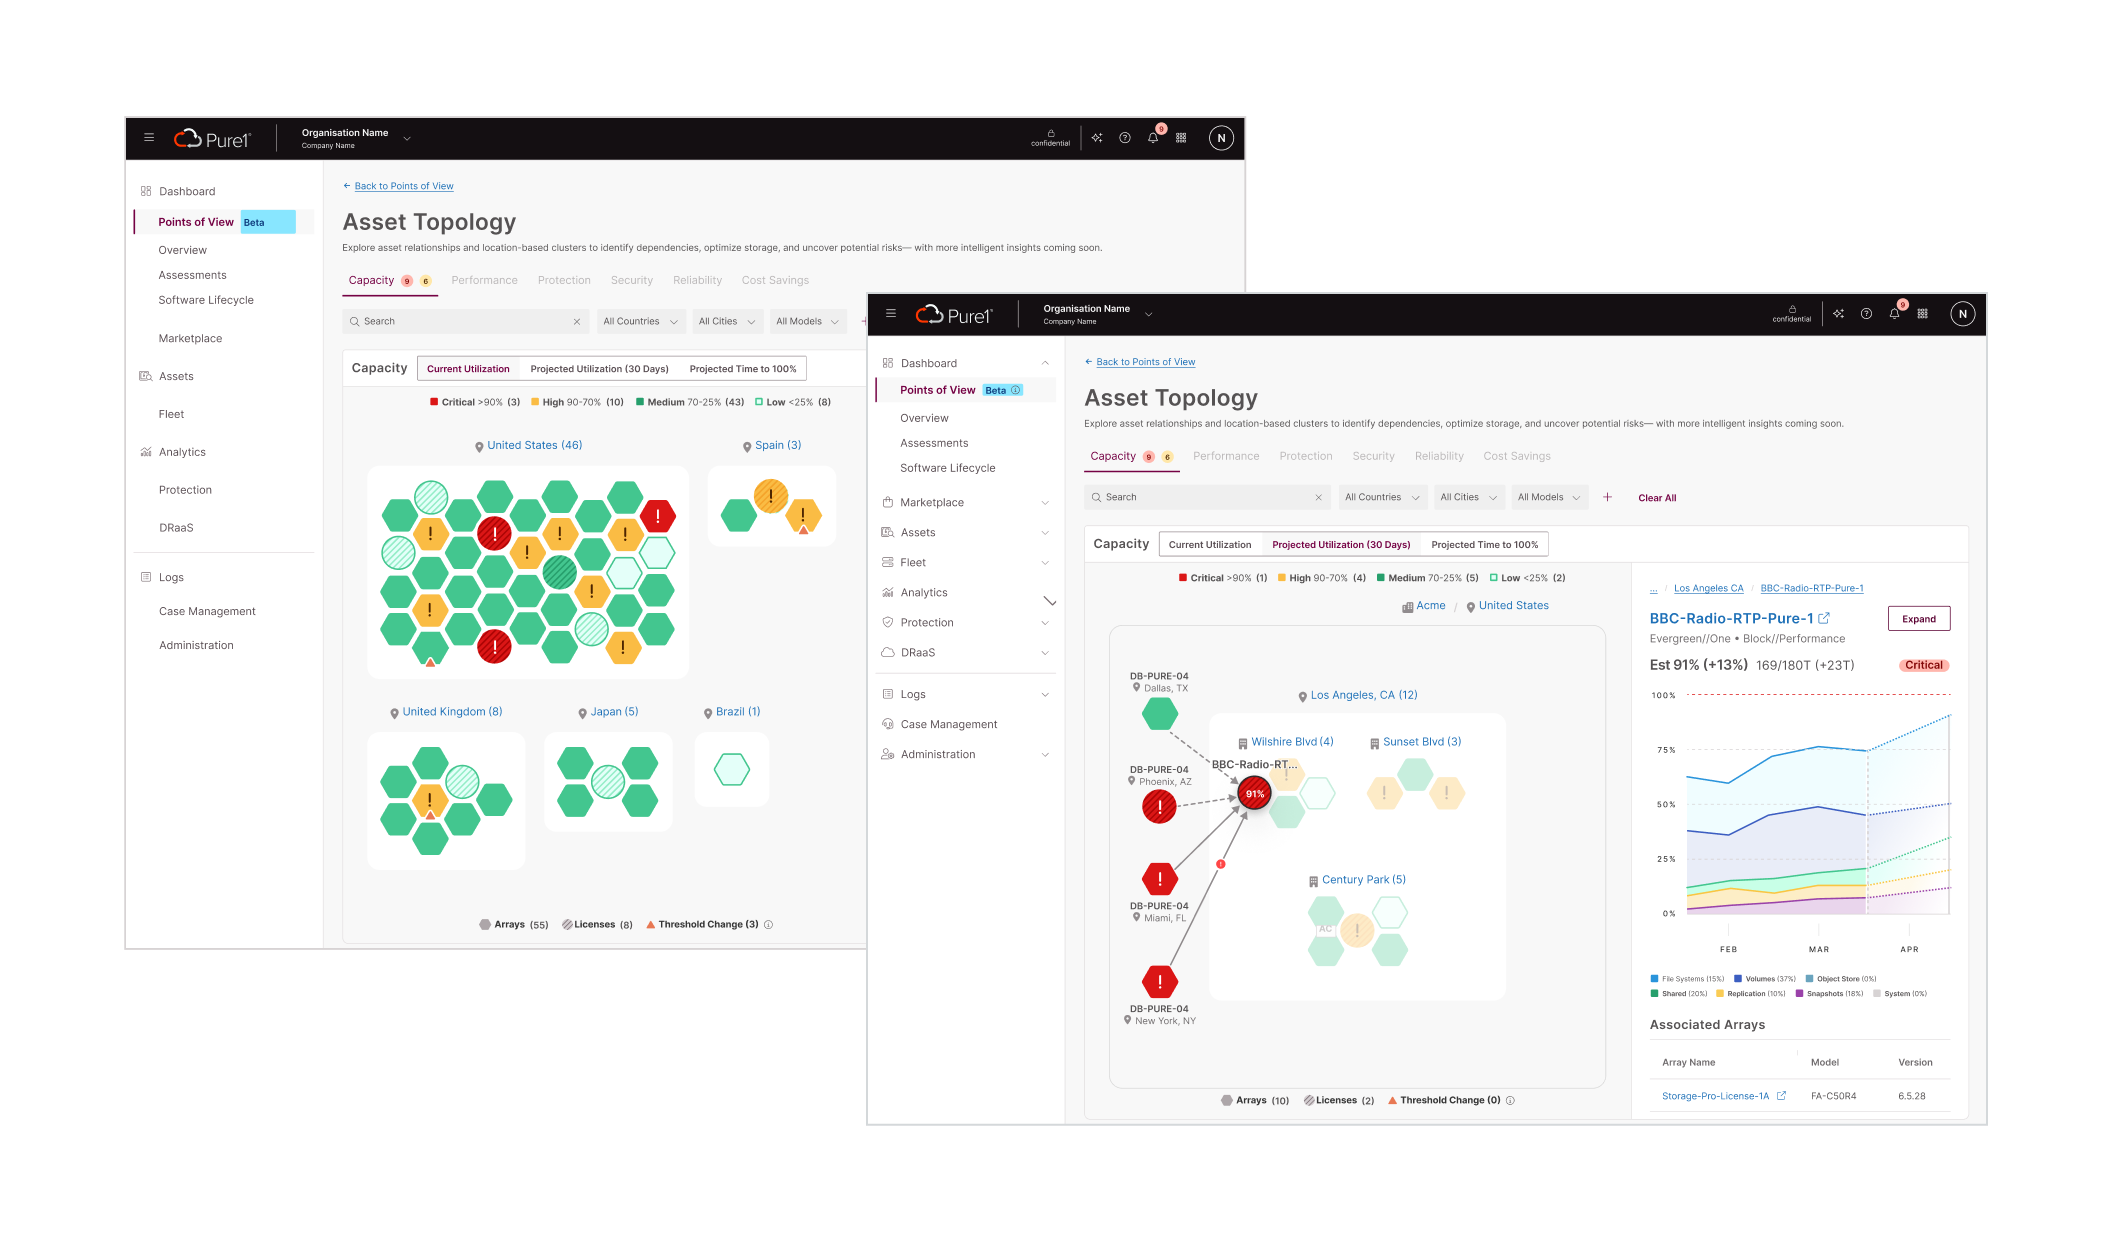
The top section allows the user to see across all of their arrays, the heatmap shows the arrays by regions connected by proximity with levels of zoom, and the asset card on the right shows metrics. This tested well with users, especially for using it in the ‘war room’ context to investigate ‘live’.
Making the Vision Tangible
I collaborated with the Visual Designer on another workstream to apply the visual design she had created. We worked through translating the wireframes into visual design and a prototype.
1 Understand Enterprise User Needs
2 Visualize the Storage Infrastructure
3 Unifying the 2 Products
4 Translating to Production
The monitoring page across the 2 products was just the start of the platform conversation. The broader question was the role of each product, their relationship to each other, and how to manage overlaps and distinction, or just bring them together.
Mapping the Offerings in the 2 Products
I focused on building trust with the 2 teams first through ecosystem maps to understand the current state and where it was going.
I knew that this wasn’t going to be an individual effort and that I would need champions from the 2 business units, culminating in a platform workshop. I then worked with the Sr. Dir. of PM on choosing those champions so that the concept could live longer within the company.
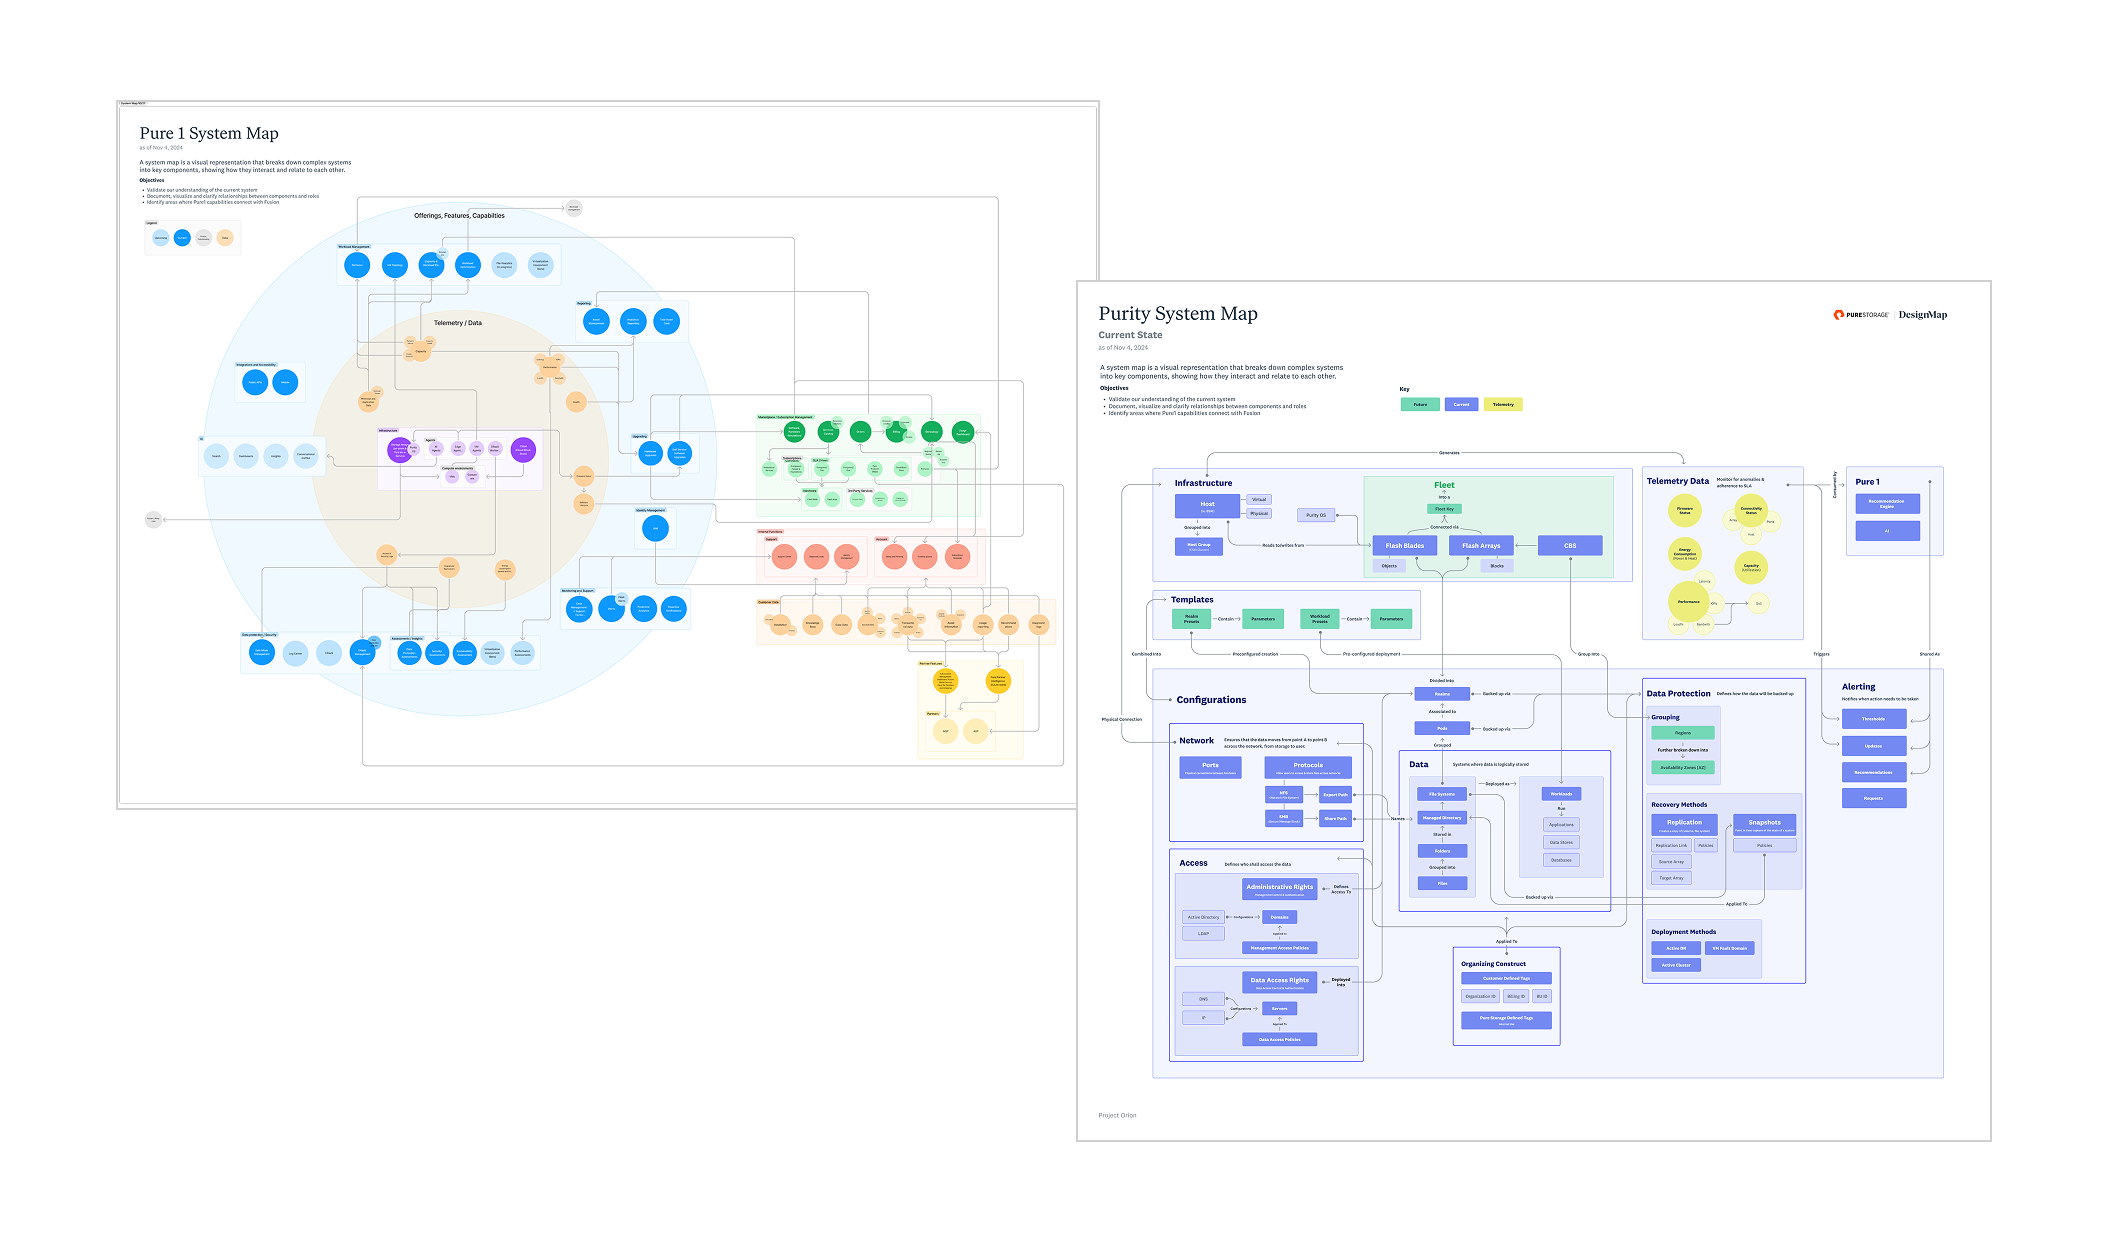
I identified and learned about the different components but more importantly, I needed to show the different business units that I knew their products well and that they should start to trust me.
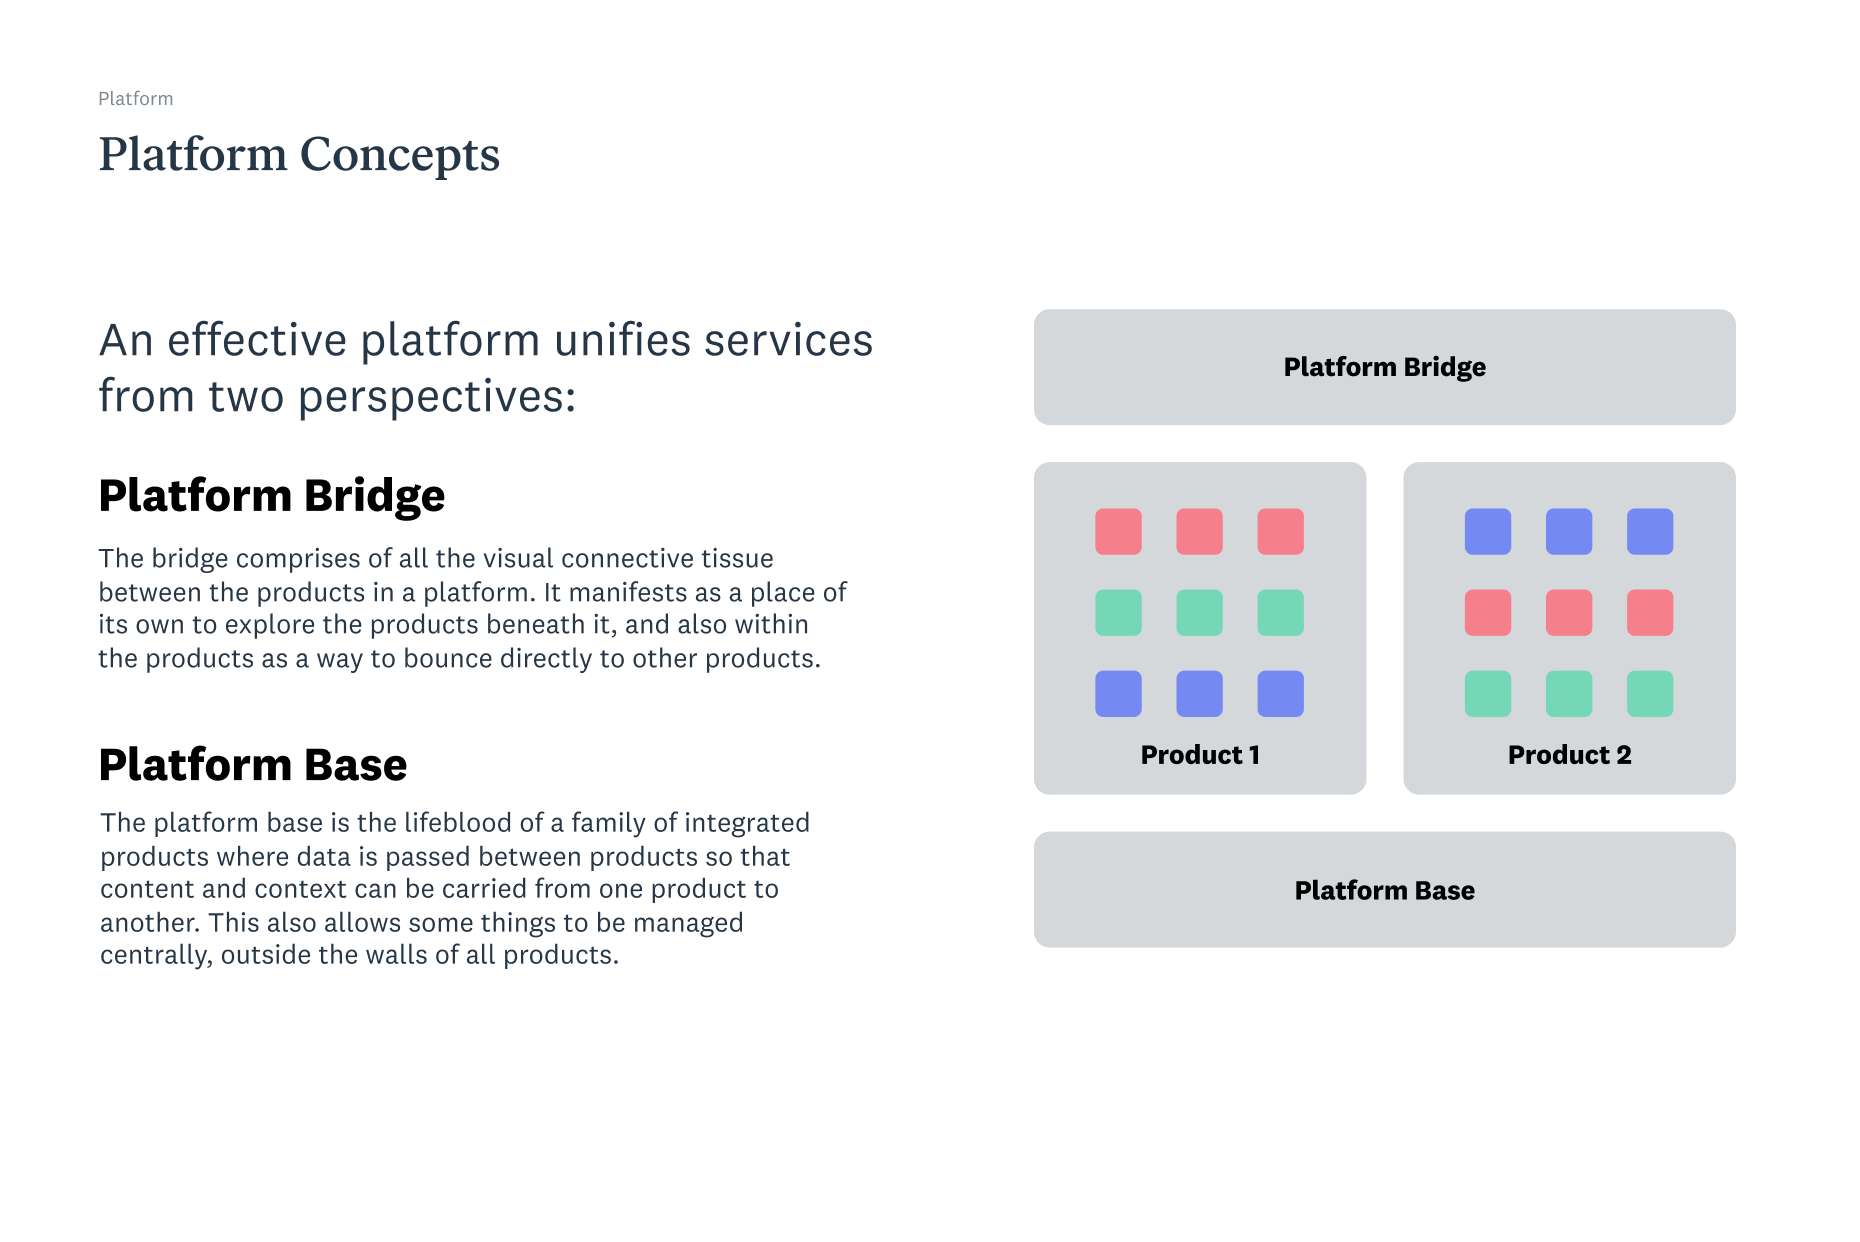
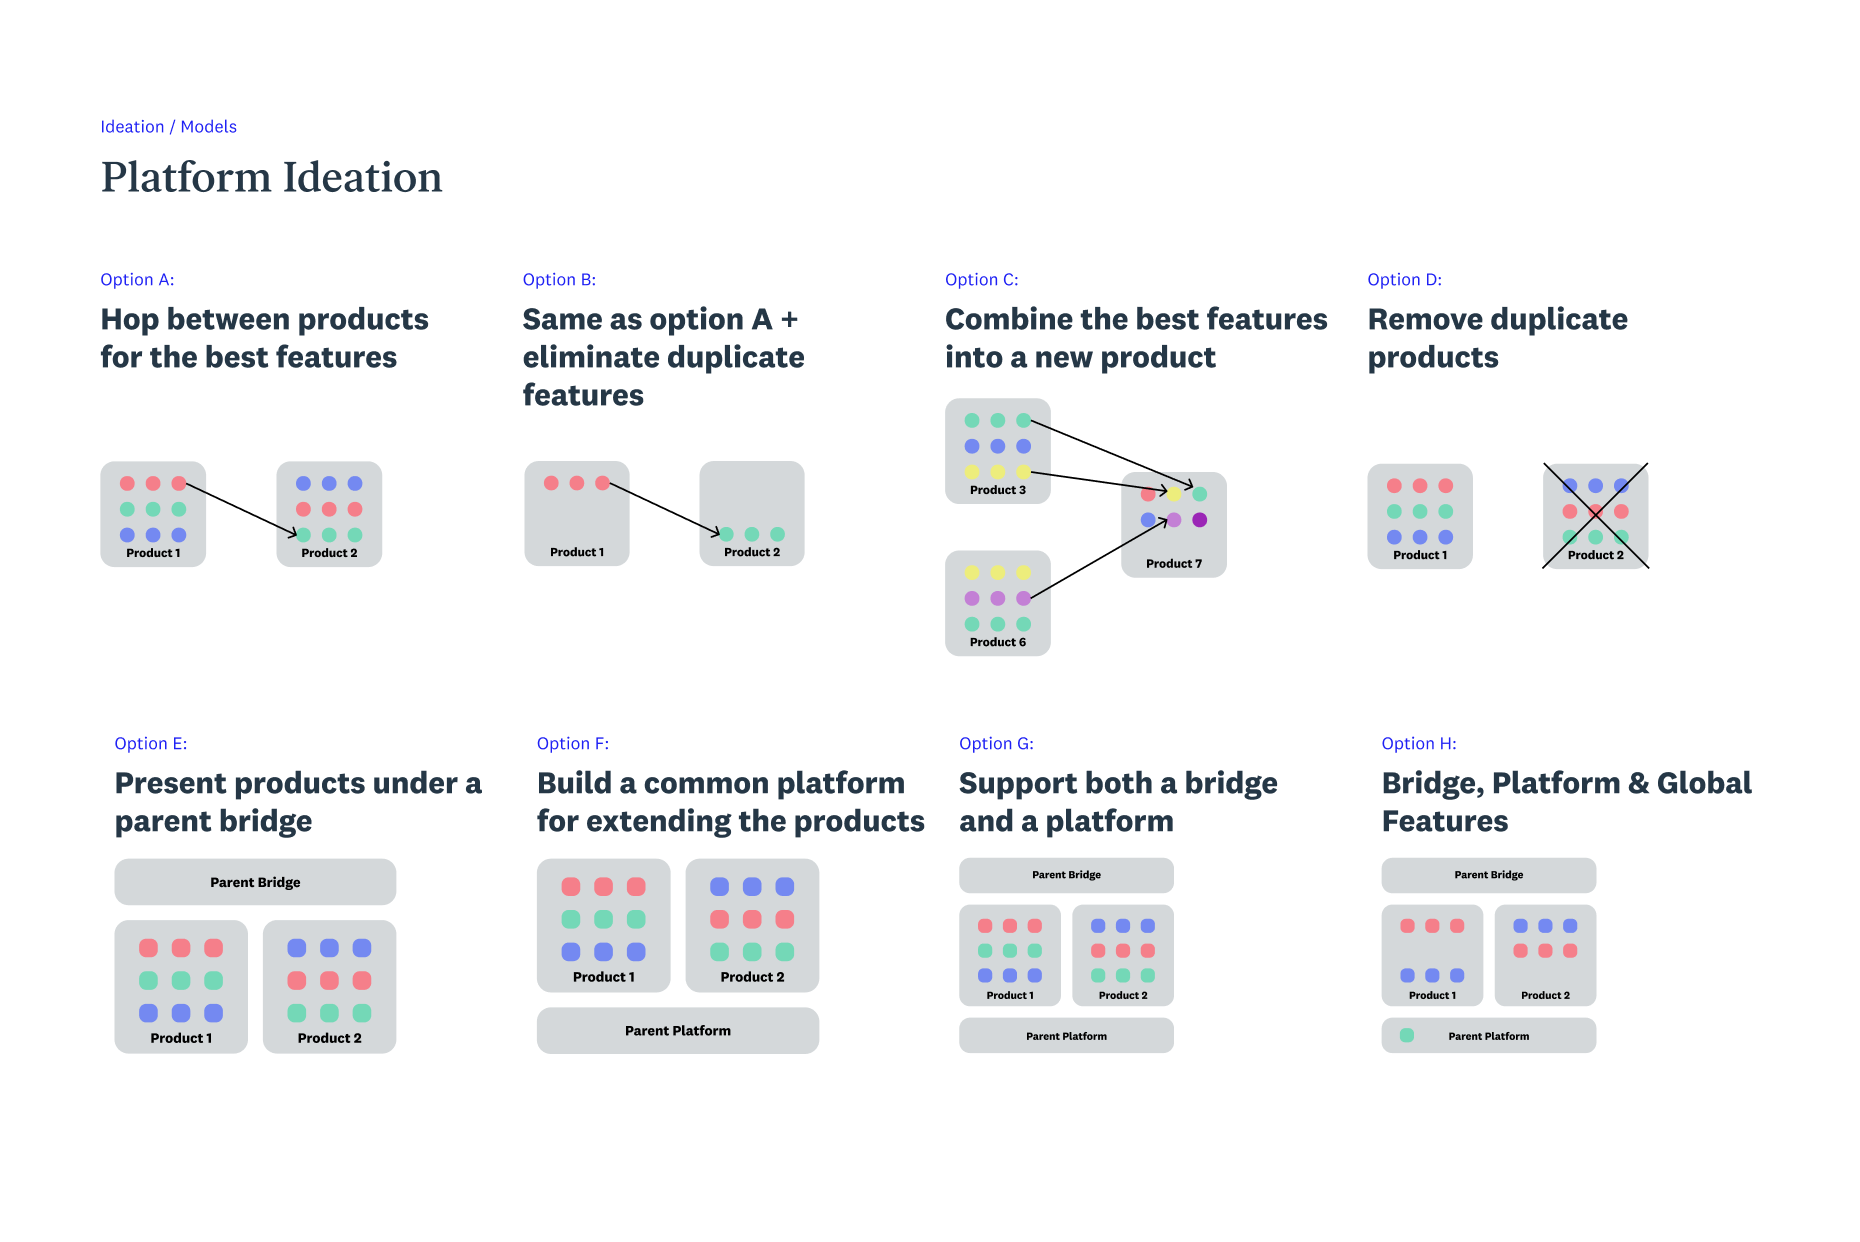
In the workshop prior to the primary activity of creating a single navigation, I shared about platform concepts and the different components as well as common platform ideation techniques to make sure the team focused more on the objectives rather than people.
Using IA to bring the products into a platform
I had to simplify the concept of how to bring the products together and have the 2 business units thinking more like a single platform.
In the platform workshop, I introduced platform concepts but most importantly, I made the key activity about creating a single navigation across both products to start these different business units thinking like one.
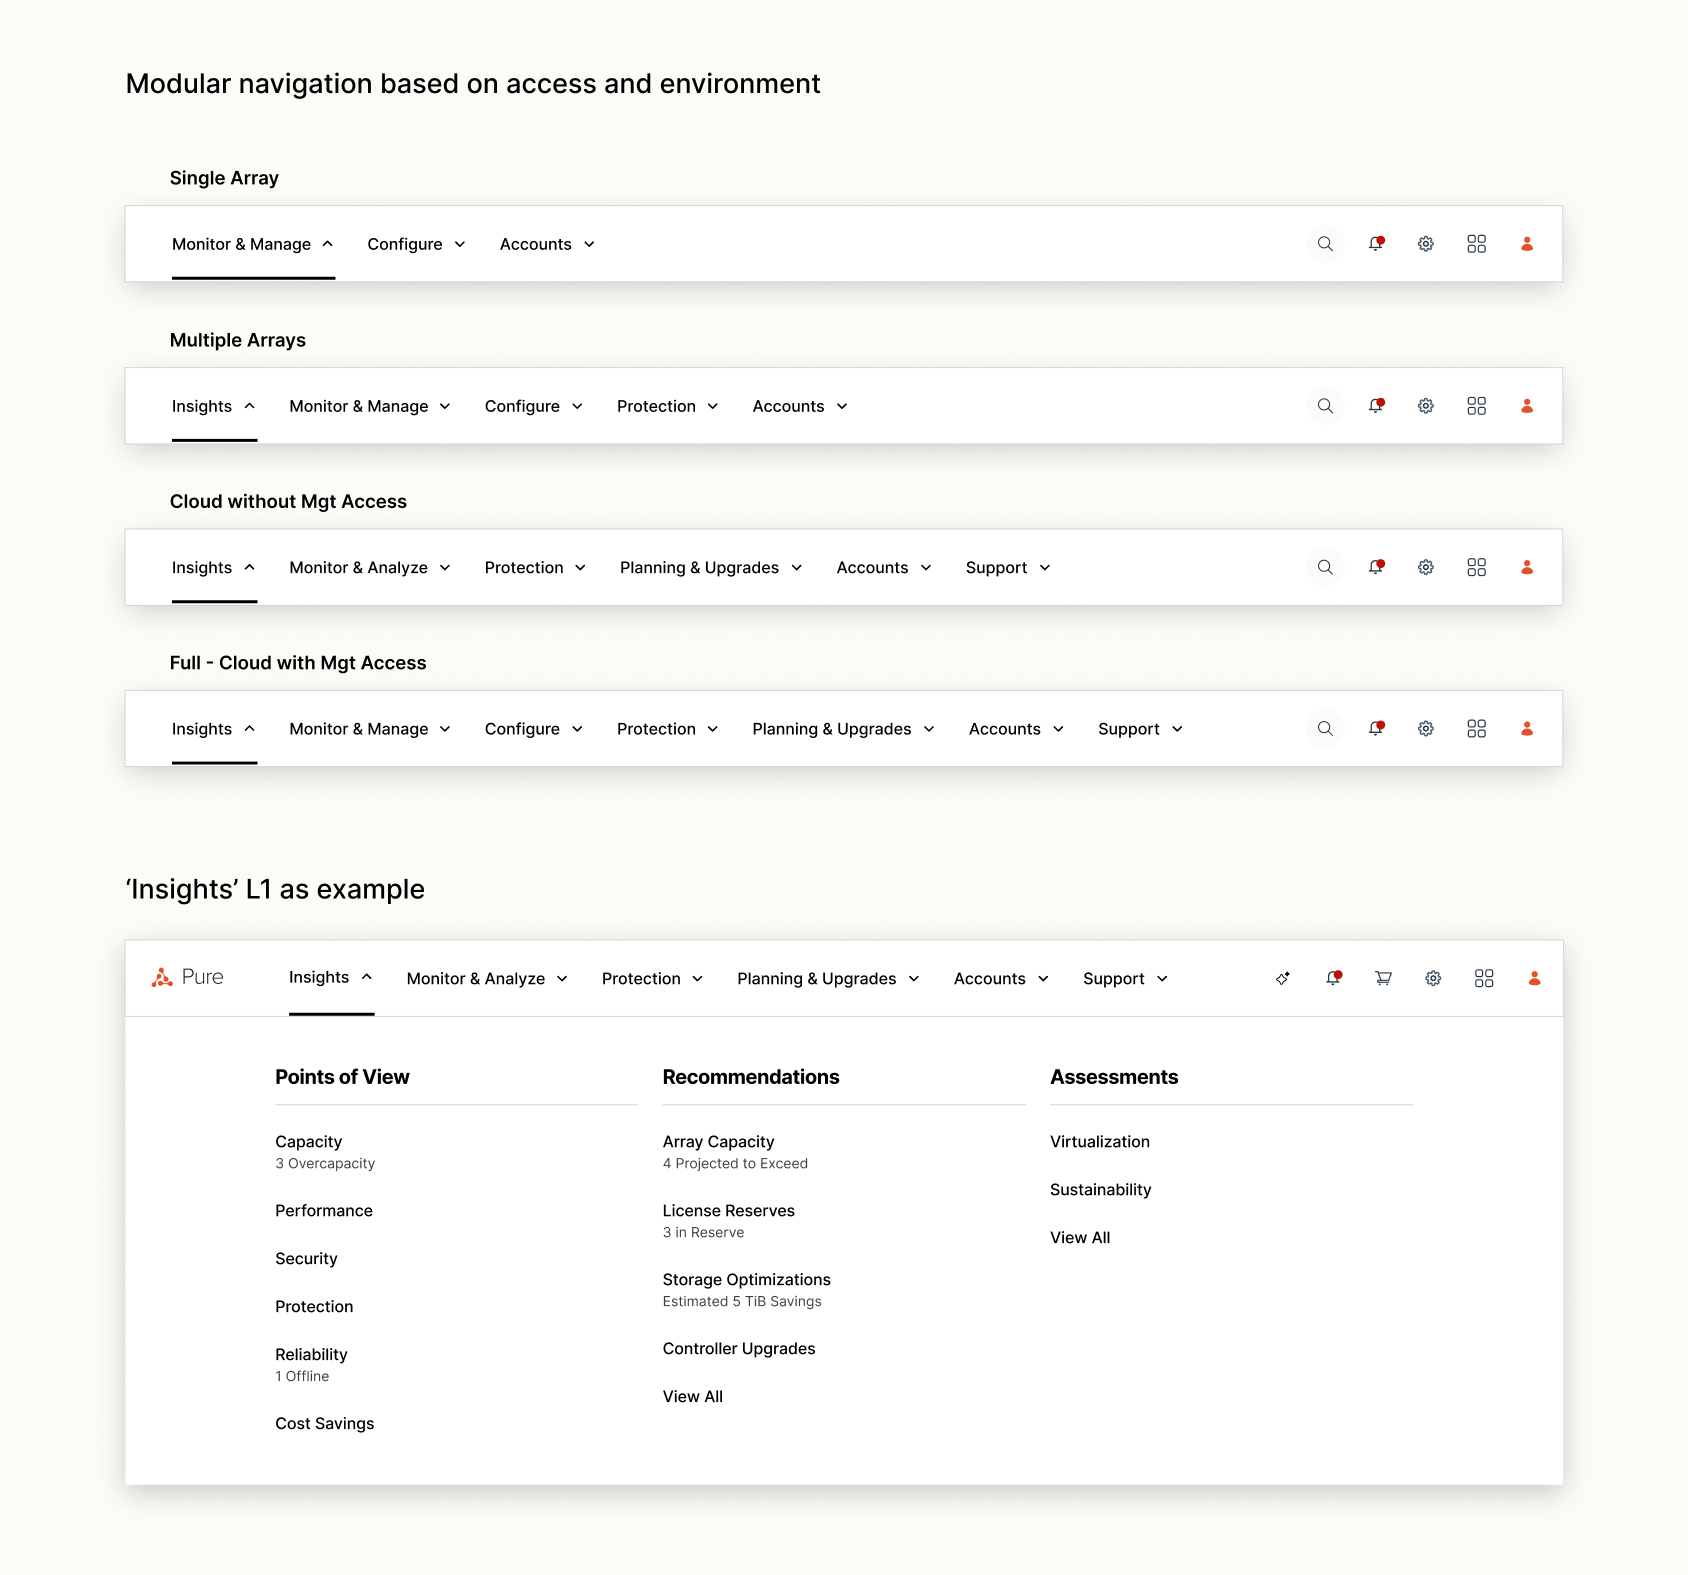
Using the outputs from the platform workshop, I worked through the concerns the team had especially on the different levels of access from a single array to full cloud monitoring and management access.
1 Understand Enterprise User Needs
2 Visualize the Storage Infrastructure
3 Unifying the 2 Products
4 Translating to Production
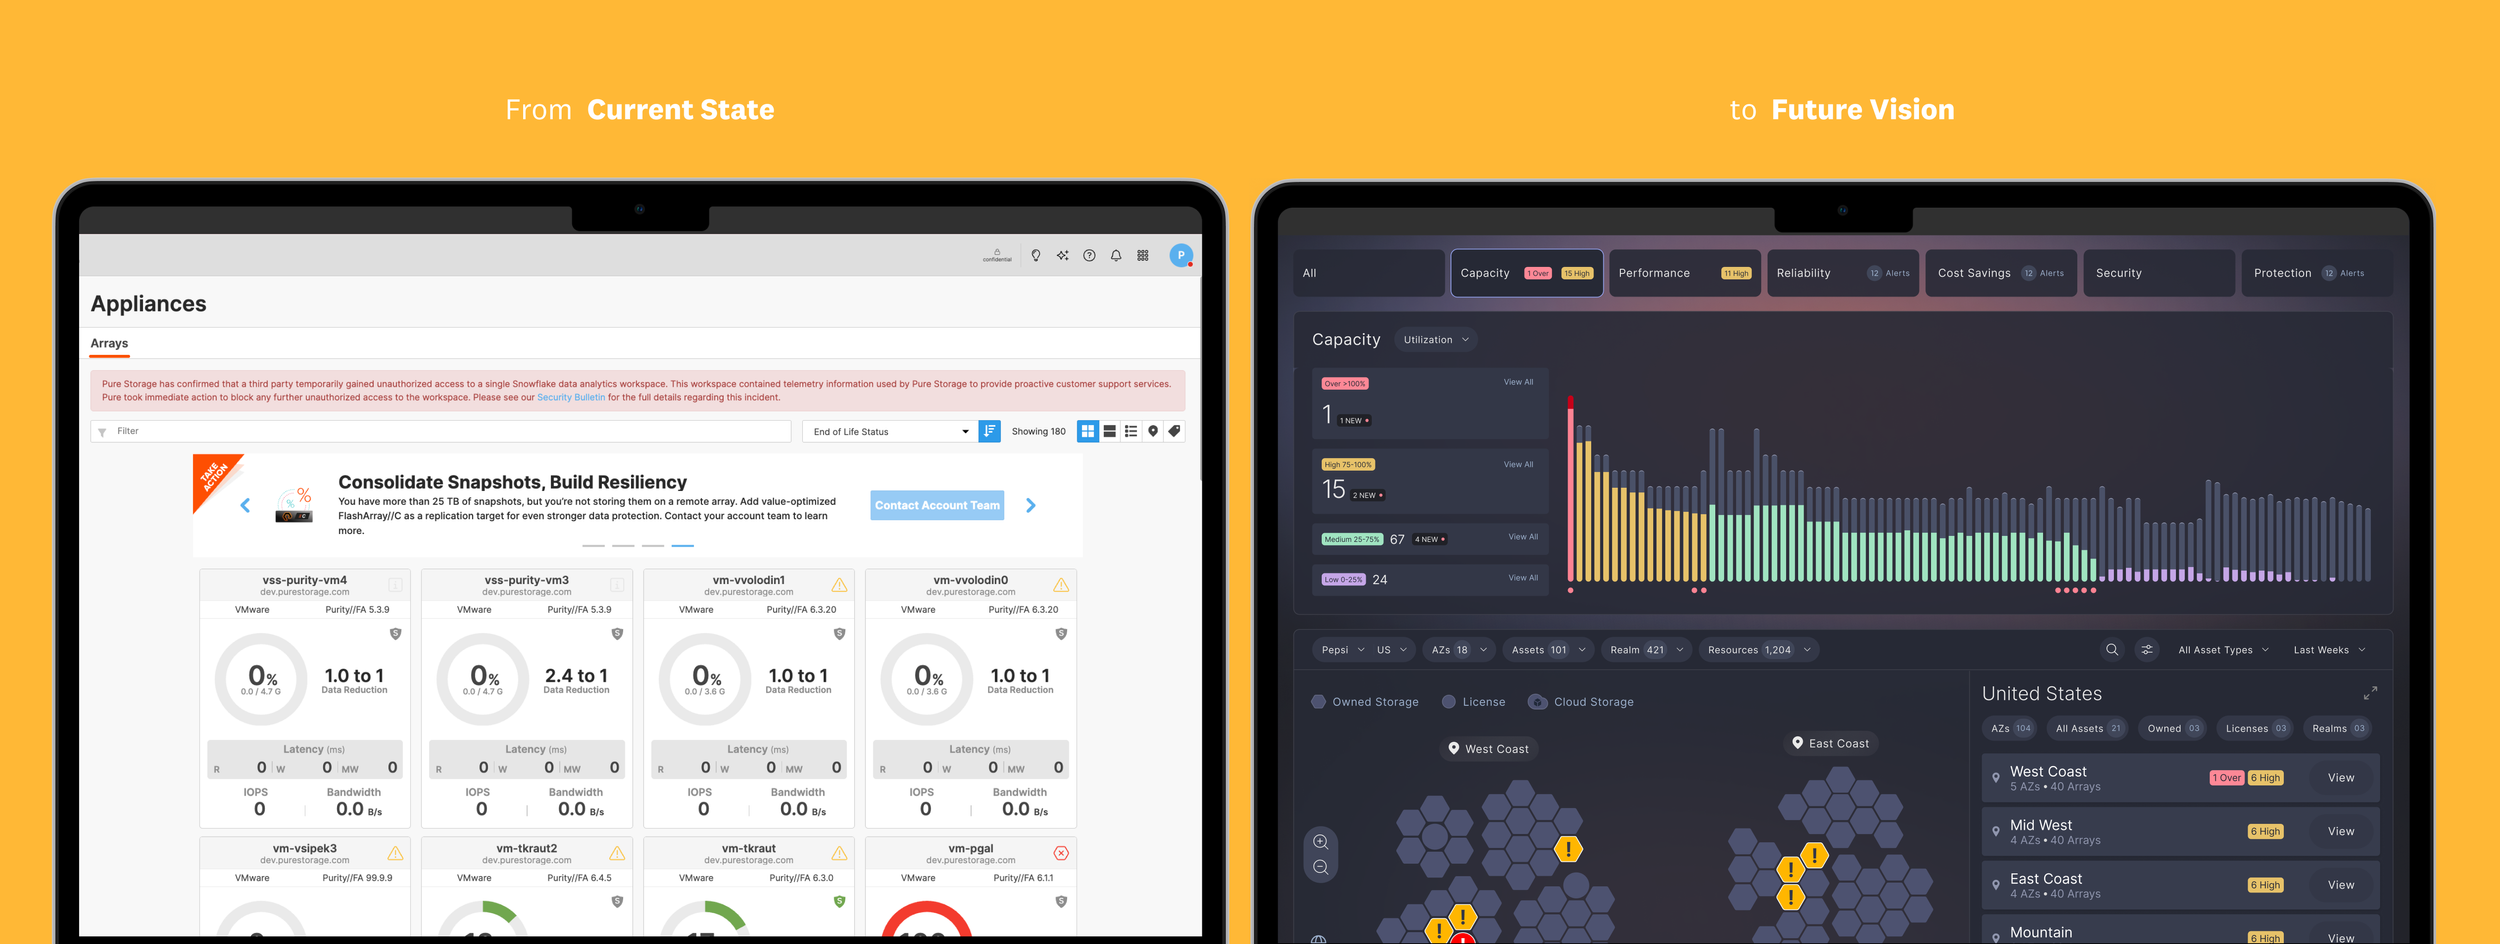
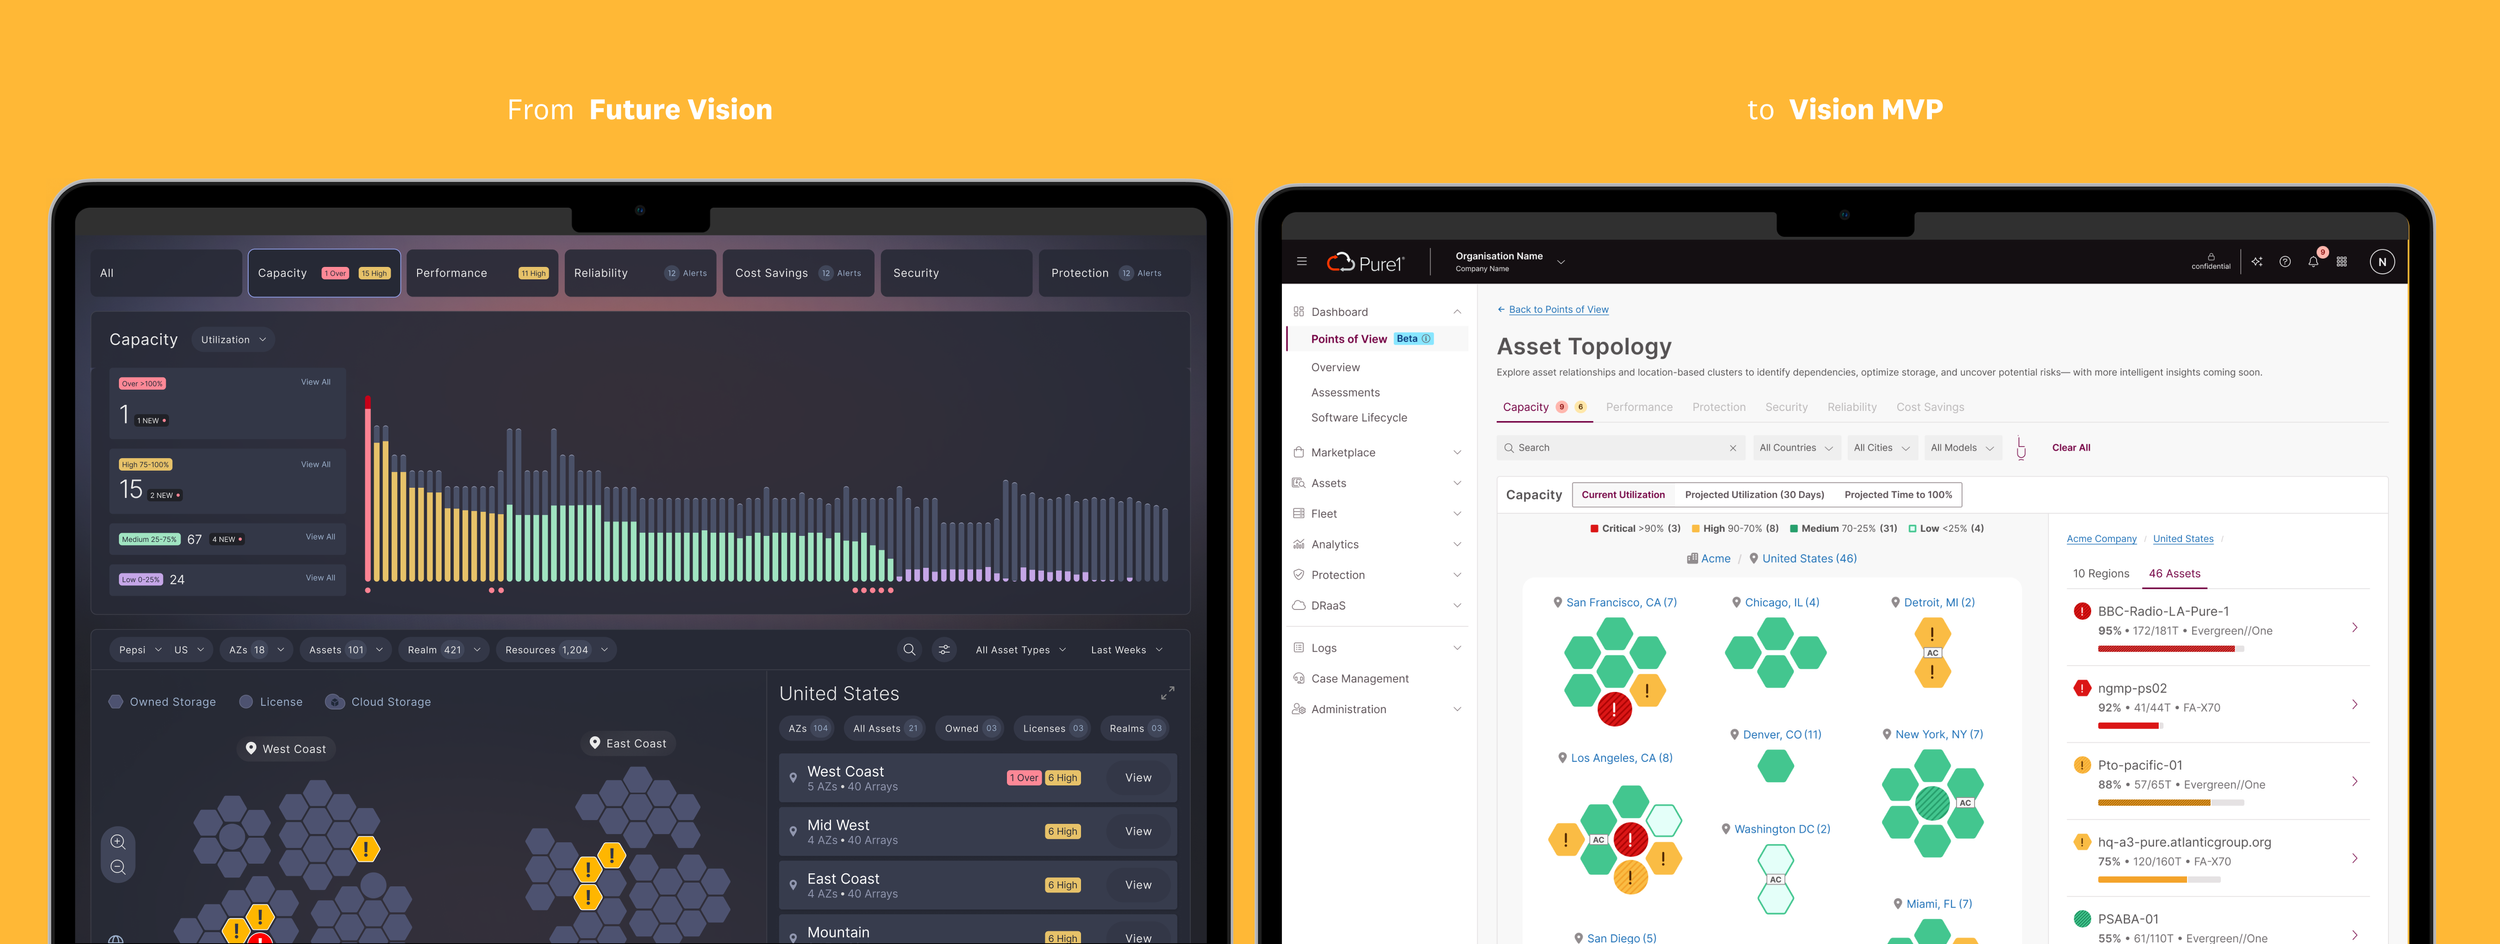
After co‑presenting the vision to C‑suite with the Sr. Director of Product Management to secure funding, a small design team (just two of us) collaborated with Development, QA, and Data Analytics to translate aspects of the monitoring vision into production.
Balancing the Vision and the Constraints
While it was important for us to take into account constraints such as visualization library, current design system, and technical capabilities, it was also critical that we hold true to the vision as that was what got the customers and leadership excited about the future.
Worked through the iterations with development and QA to take into account data, visualization and technical constraints for each of the components. The developers were also excited about what we were building and kept the vision in mind when offering alternatives.
I detailed out the documentation for different components such as the different levels of zoom and others with the other product designer to ensure the developers had what they needed for the sprints.
Worked with the design systems team to make sure the components passed their internal checks for standardization and that new components went through their vetting process.
Learnings & Takeaways
It’s not often as a designer that you get to design a 2-3 vision with Sr. leadership and then have the opportunity to build some of it with developers and put it into hands of customers so quickly.
This was a great end-to-end experience for transitioning products for SMBs into the enterprise context.
Finding clarity through subtraction
The hardest part wasn’t adding features or information, it was taking away. Every element had someone advocating for it. Every detail felt important. But the real challenge was deciding what to hide, what to surface, and how to say less without losing meaning. At times, I got caught up trying to include everything. That takes restraint, patience, and iteration.
The hidden danger of poor problem framing
Reframing the design task can help simplify the problem. Be careful of words used to describe the task for yourself and others as it may lead to solving the wrong problem. During the visualization exercise, I got too caught up with creating visualizations and lost sight of the overall objective. That takes insight, precision, and discipline.
Other Projects
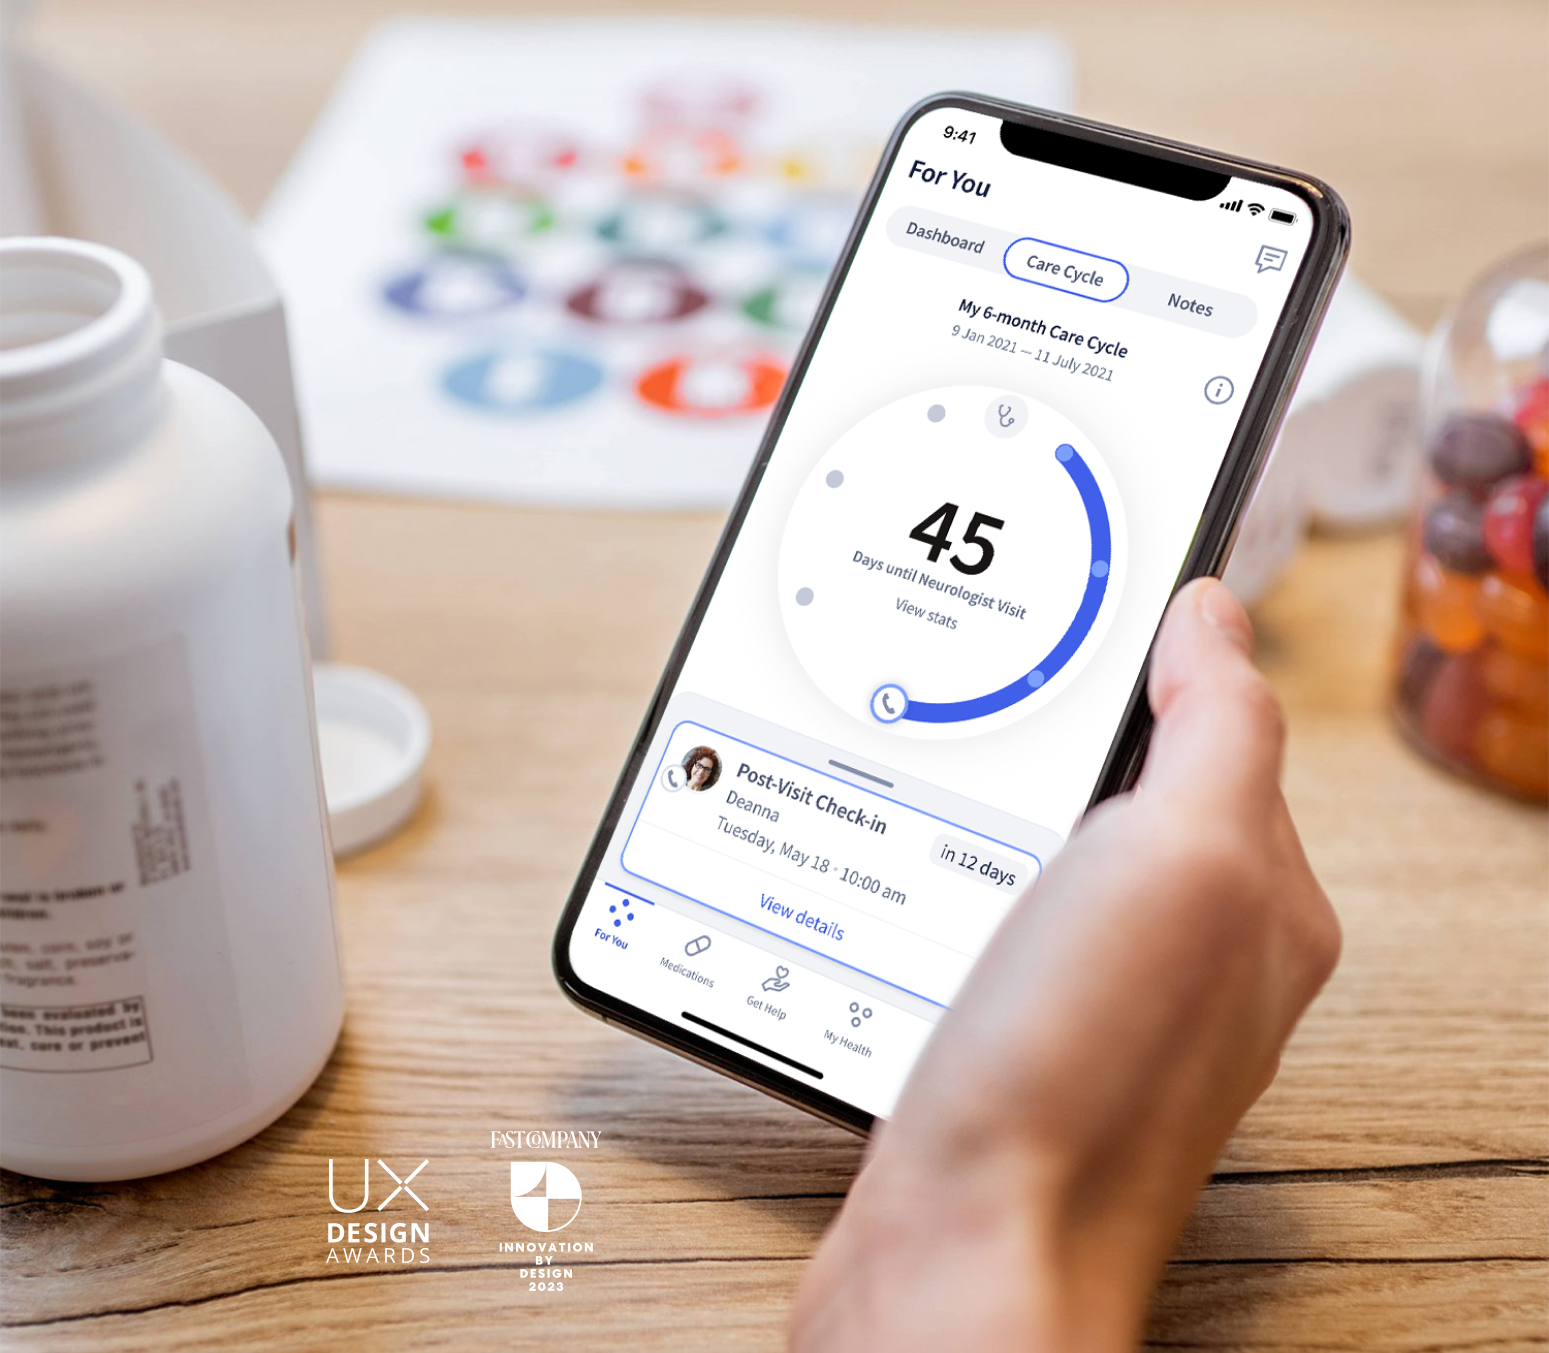
Healthcare • 0–to–1 • Mobile/Service Design • B2B2C
Building the First Offering for a Health Platform for MS Patients

Human Resources • Service Design • B2B