
Bloomberg
Compliance Data for Financial Outcomes
Type: Vision | Role: Lead UX Designer | Design: Data Visualization | Duration: 3 Months
To comply with the non-disclosure agreement, I have omitted and obfuscated confidential info. All info in this case study is my own and does not necessarily reflect the views of Bloomberg.
THE ASK
Enable compliance to be a potential profit center, not just a cost center
Bloomberg Compliance, which surveils and records communications data for financial institutions to manage their regulatory risks did not want their customers to just view them as a cost center, but to use that same compliance data as a business driver of financial outcomes.
Our executive sponsor had been struggling to get approval and funding to realize the vision of transforming the data and having to balance the internal politics across the organization, we focused on the following
Showcase how it would complement Bloomberg’s offerings
Source for compelling use cases across the organization
Move the vision beyond a slide deck, and into a tangible prototype
MY ROLE
Served as the translator of the executive sponsor’s vision (in his head) and to get the organization to fall in love with the potential new offering.
Executive Sponsor Whisperer
Worked with the Exec Sponsor to articulate his vision and translate those concepts into the prototype.
Organizational Mediator
Served as the peacemaker across different departments to align on a vision that creates value for them and the org.
Change Agent
Identify sources of resistance and use different interventions to address concerns while pushing for change.
Complement Bloomberg’s Offerings
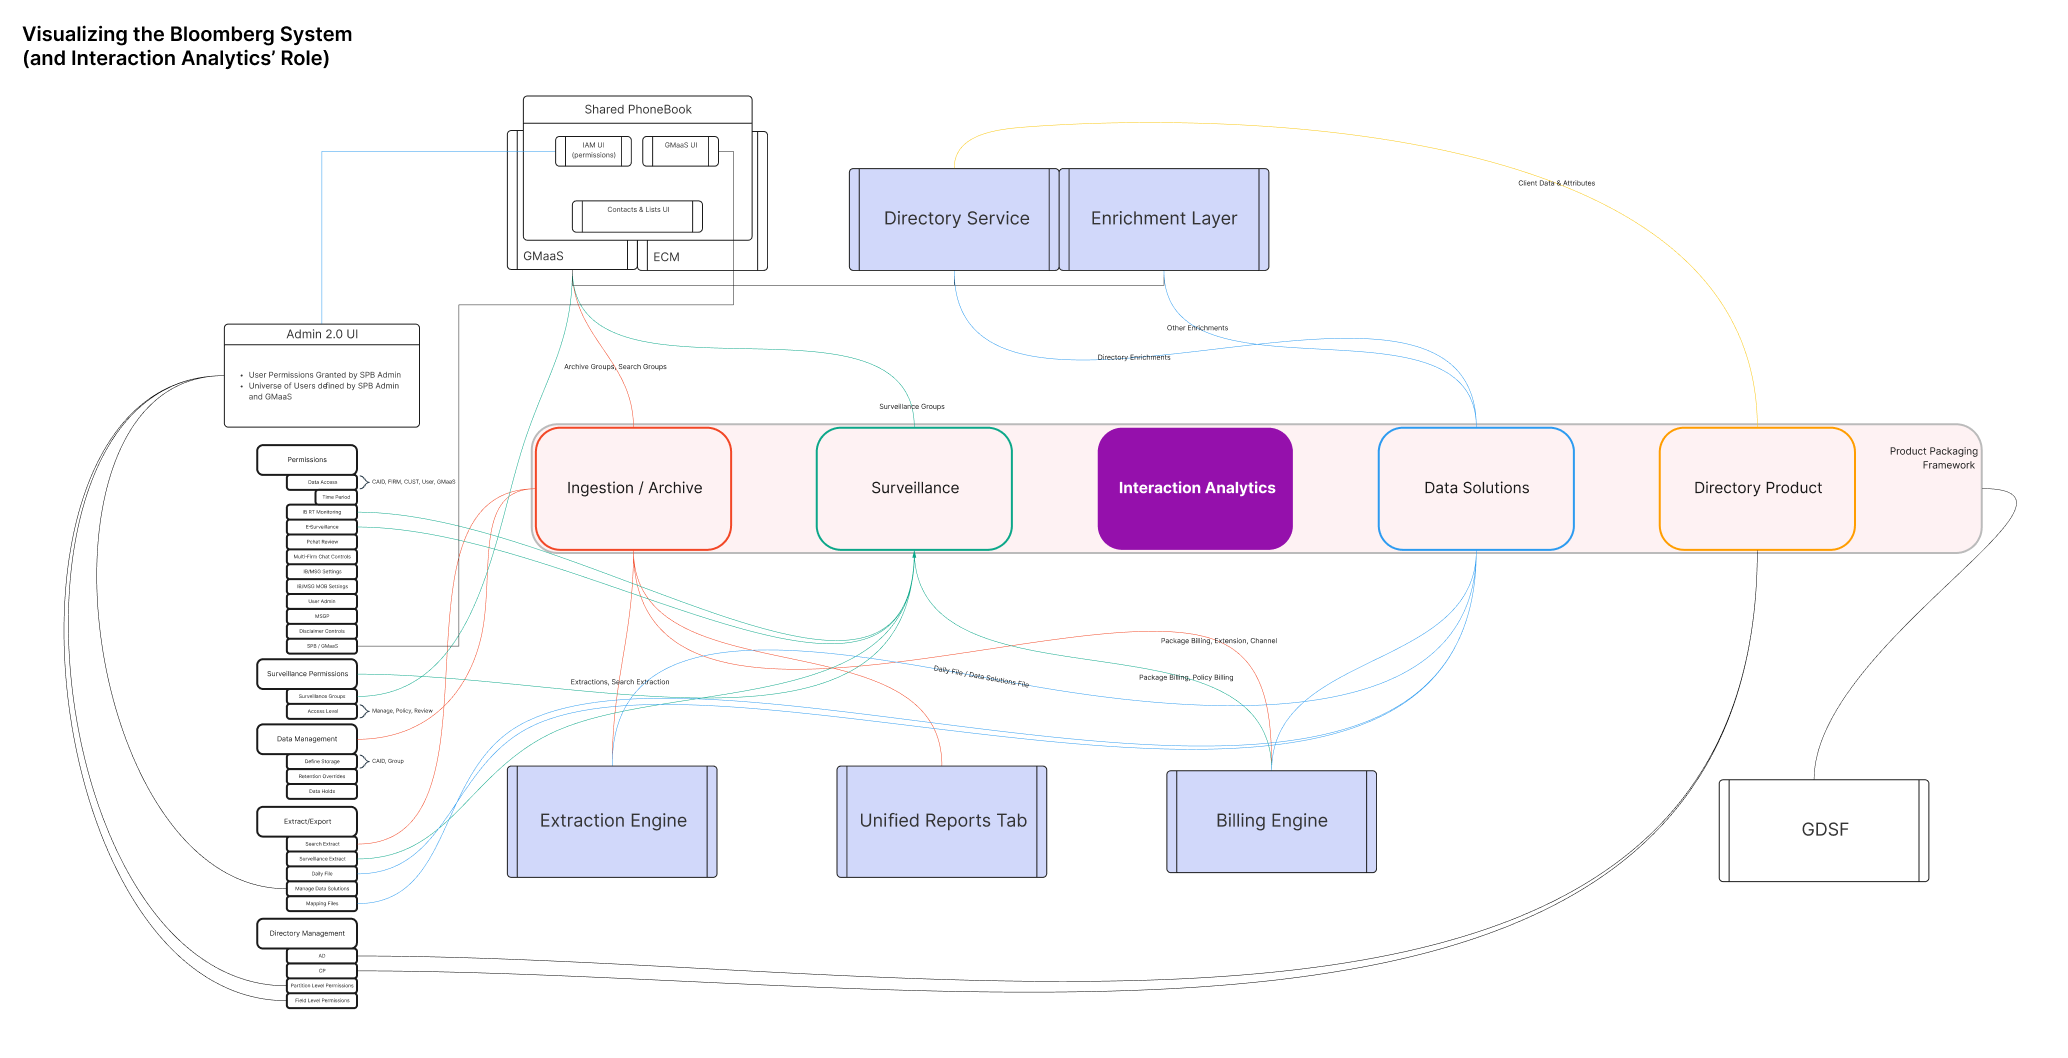
I built a system map of the different Bloomberg offerings to highlight their interconnected and complementary roles and how the new compliance data product, Interaction Analytics, could connect and empower this ecosystem.
Bring the Organization Together
Everybody was busy with their day job and there were concerns about cannibalizing sales from their own product areas.
We worked across departments through interviews and co-creation sessions to get the different stakeholders to share their concerns, identify strong business use cases, and see their ideas get translated in some form into the product.

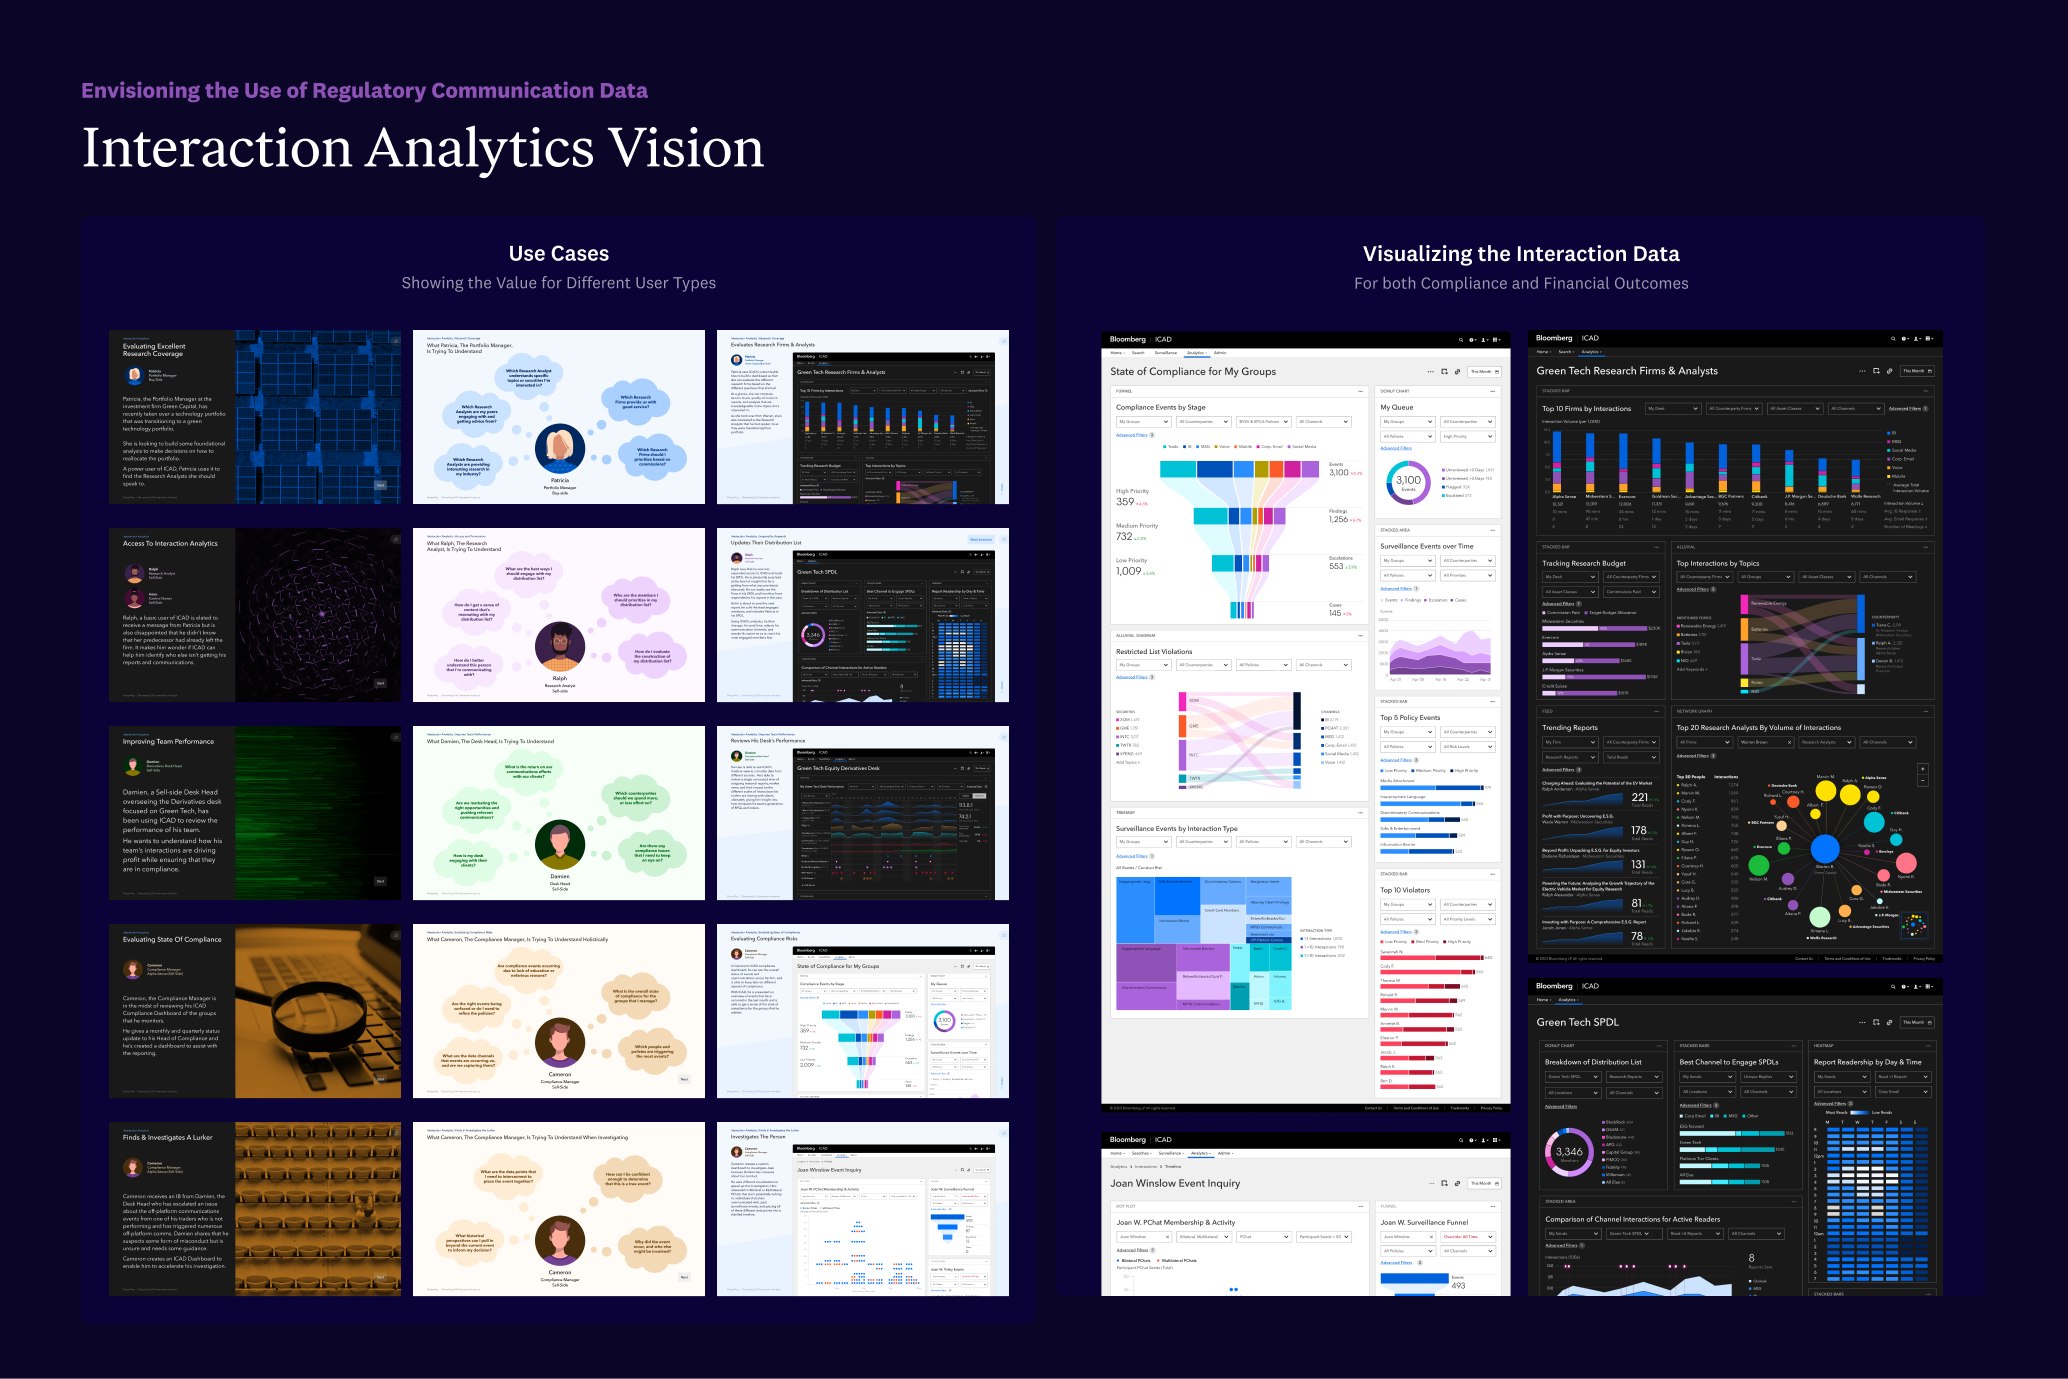
Sourcing & Aligning on Business Use Cases for different Roles
I interviewed numerous departments across the globe to understand the different actors within the system and the use cases and pain points of customers. As a team, we decided to focus on the following roles
Portfolio Manager
Research Analyst
Desk Head
Compliance Lead.
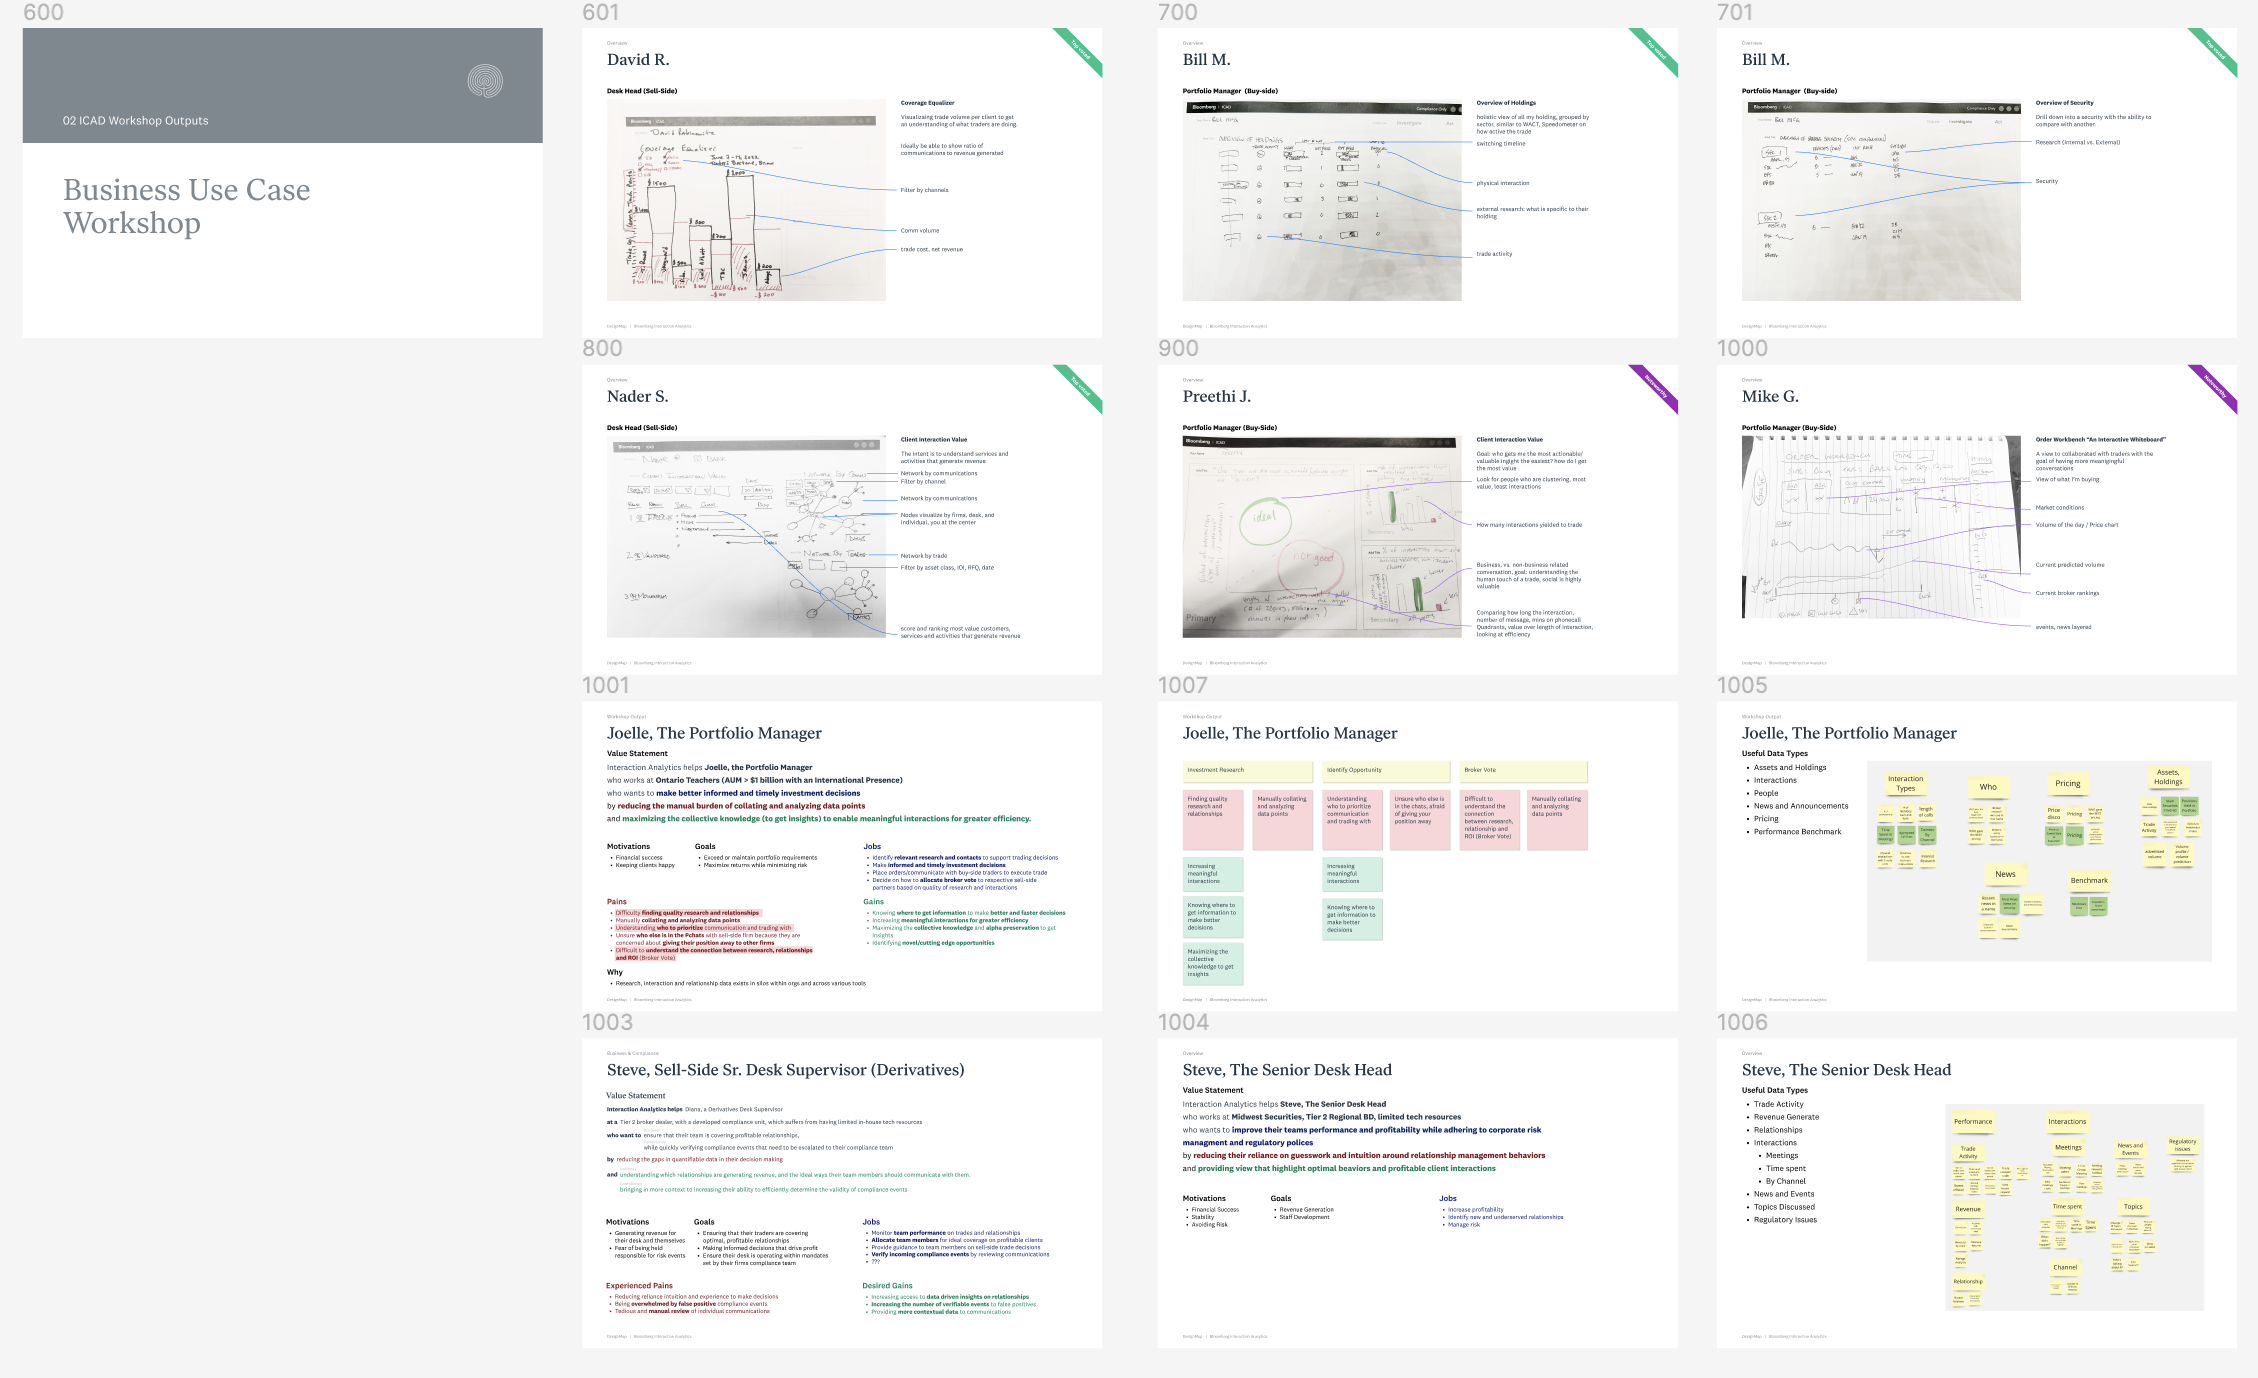
Getting Executives to Sketch Visualizations and Love the ‘Baby’
We knew it was necessary to get to a deeper level of detail with the financial executives.
I organized and facilitated co-creation sessions with both the business and compliance groups and focused on sketch concepts to use as idea seeds.
We tried to point to the origin of those solutions when moving to higher fidelity so that people could see their DNA in the product.
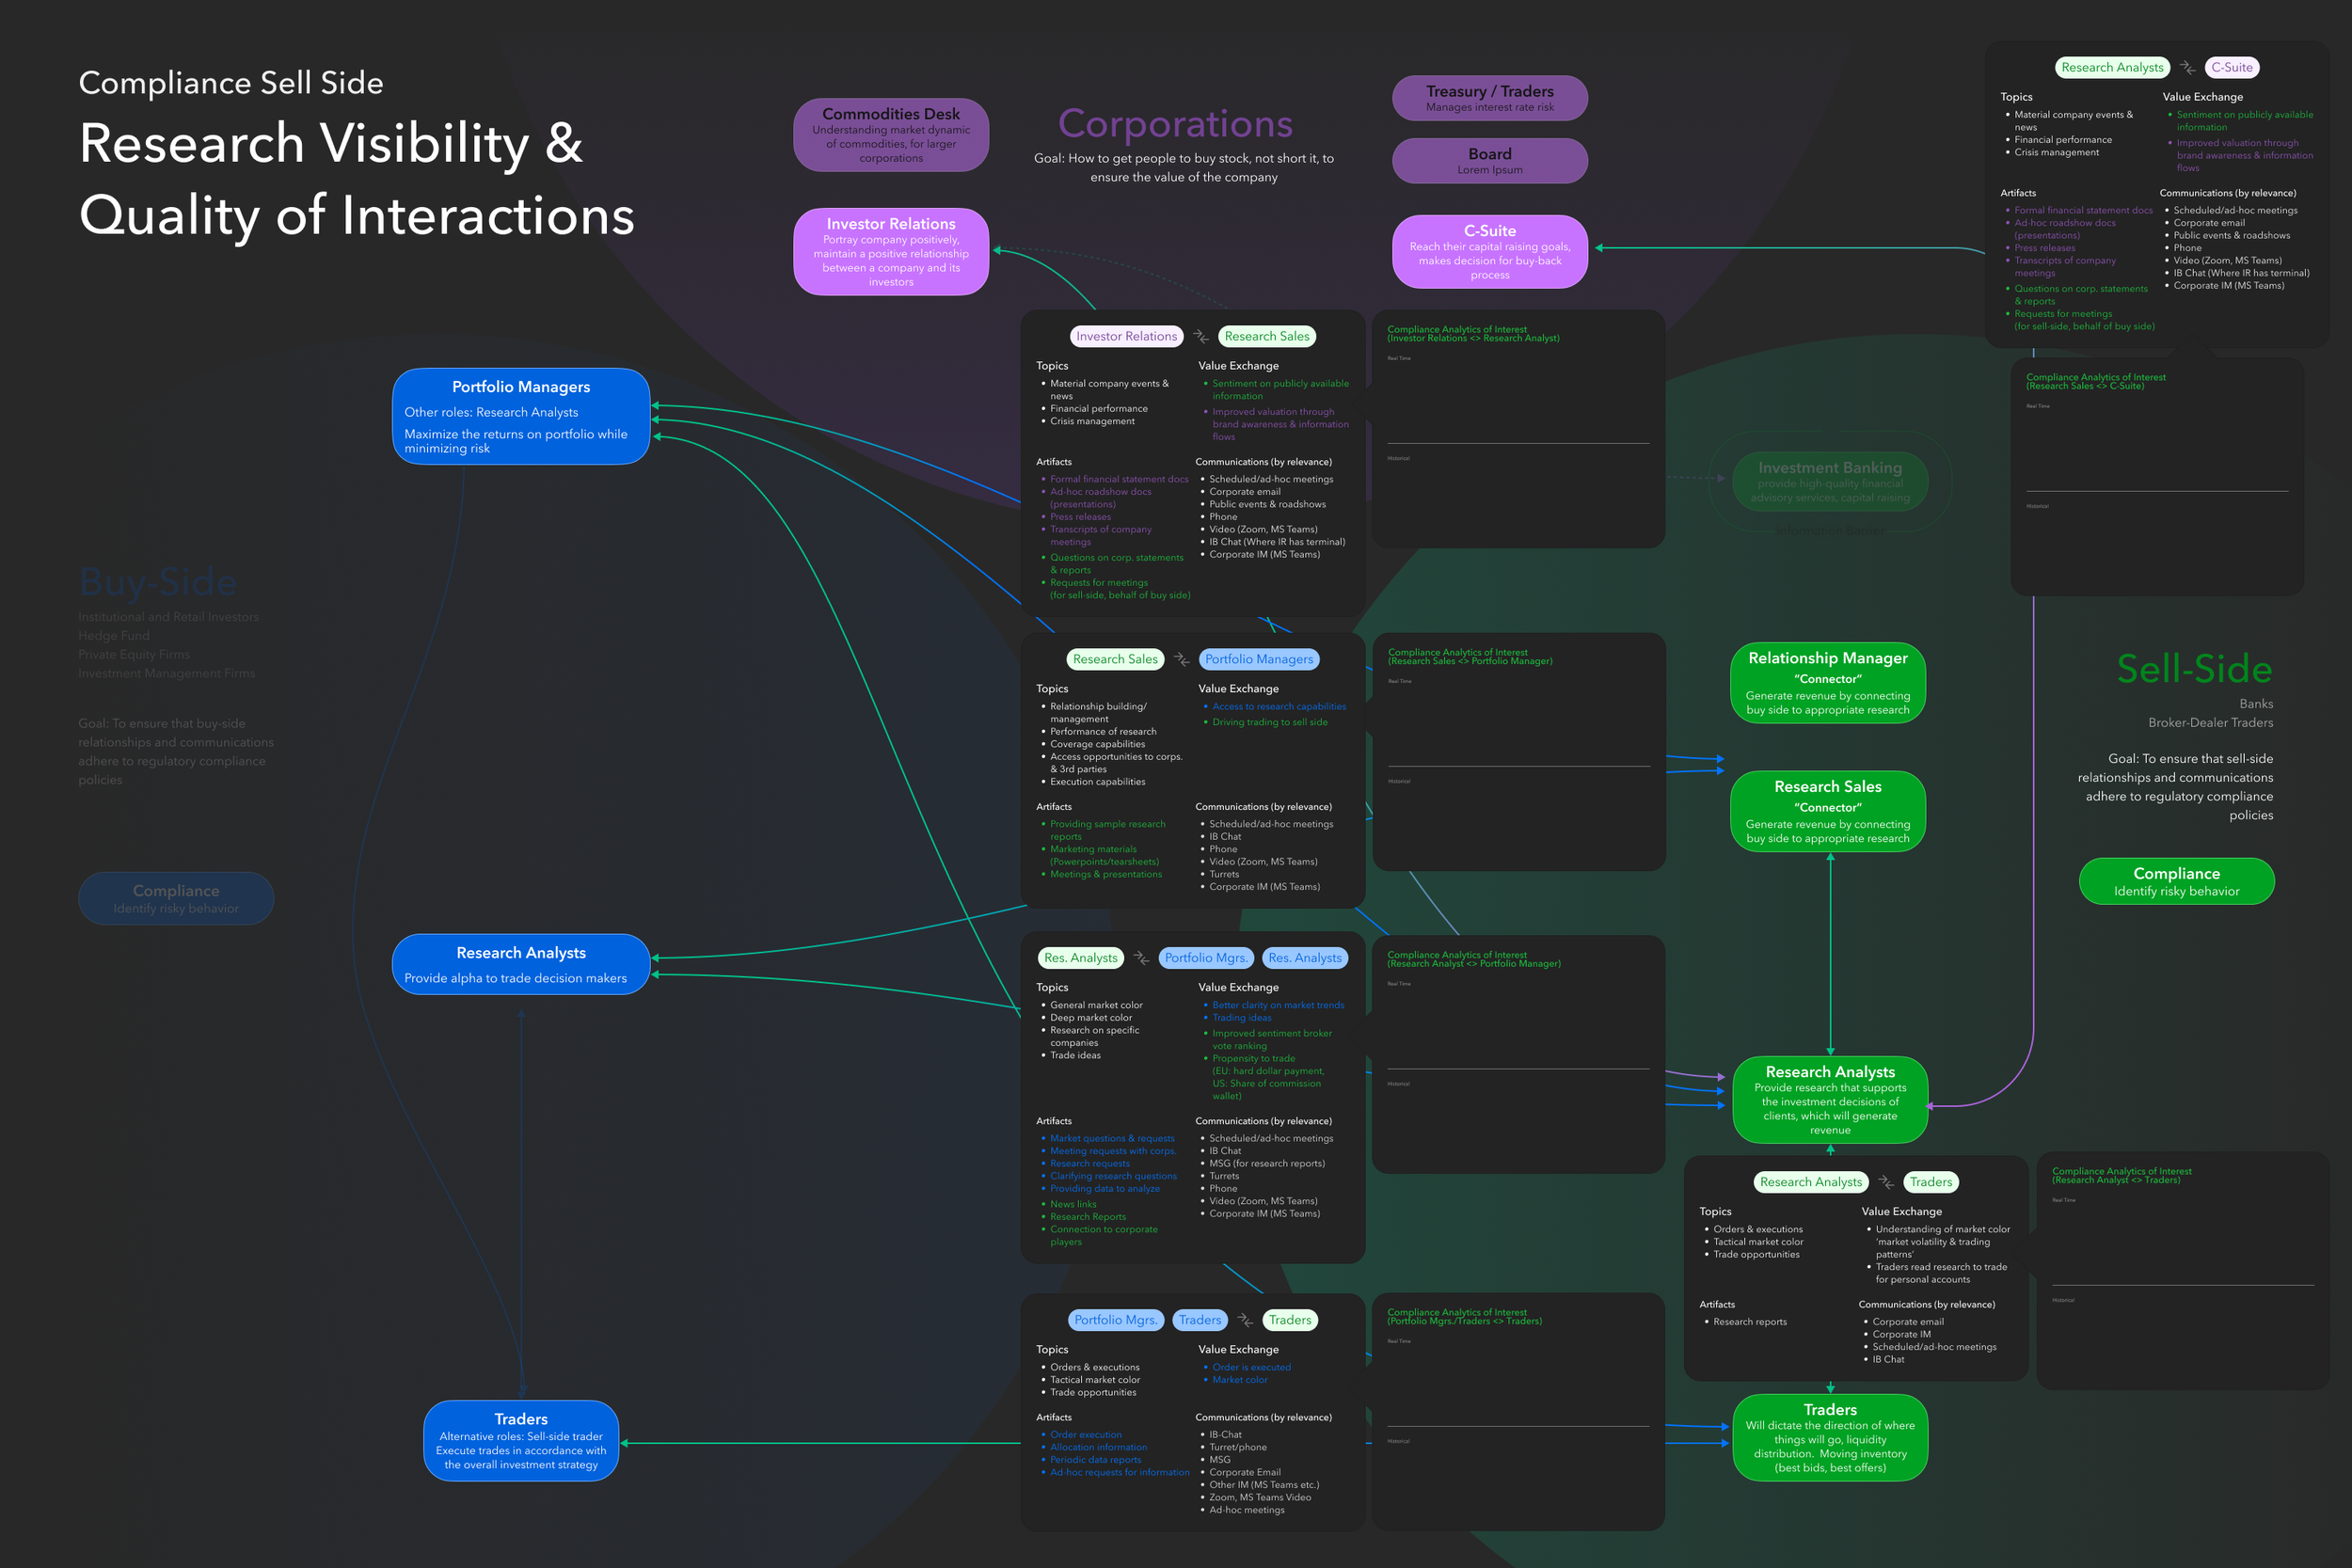
I interconnected the different roles, their responsibilities and communication data that would enhance their work into a quality of interactions map. This also showcased how Interaction Analytics could level up an organization.
Make the Vision Tangible
By getting the organization to focus on specific use cases and narratives, we created a believable future through data visualizations that rallied the organization around customers’ problems and the data needed.

Aligning around the Narrative
We aligned the team with a focus on a believable future narrative that would resonate within the organization and bring the different departments together.

Centered on the Data & Visualizations
We were not building another Business Intelligence (BI) tool so we focused on using similar visualization tiles to focus on the data and to keep the organization focused on what the data could do.
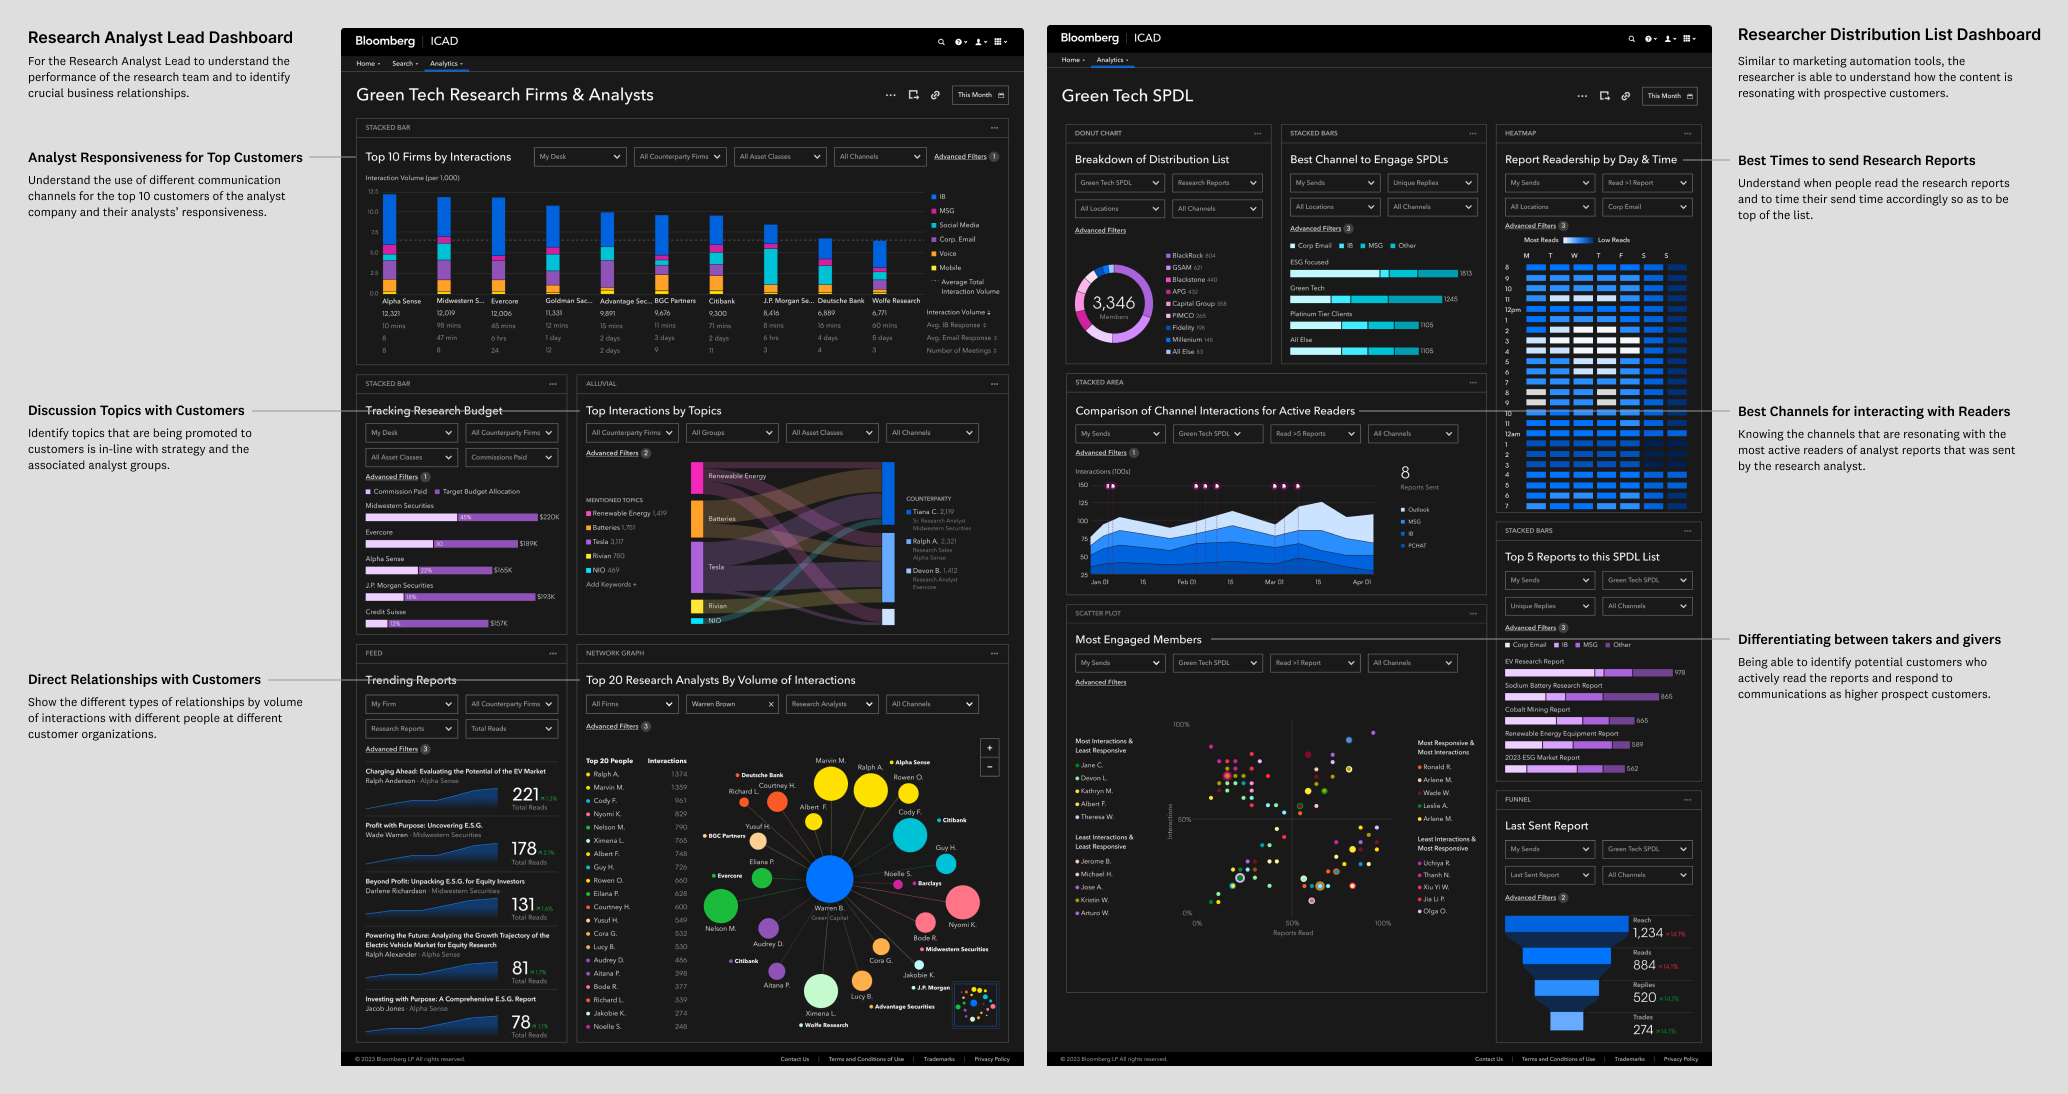
Research Analyst Lead Final Mocks
I created the high fidelity mockups and prototypes detailing the desired user experience that focused on
Responsiveness and discussions of their analysts with customers to understand how people were responding to the analyst reports.
Understand how their reports are resonating with their customers based on behavioral analytics on how they were interacting with the reports.
Compliance Lead Final Mocks
I created the high fidelity mockups and prototypes detailing the desired user experience that focused on
Overall sense of compliance across the groups they’re responsible for
Investigating individuals by correlating events and comms data to form a clear picture for compliance to make informed decisions

Outcomes & Reflections
Our stakeholder was finally able to articulate his vision in a tangible manner across the organization. He received his funding to build out his vision and came back as a contributing speaker in our company webinar to share his experience of using visions to get buy-in within organizations.
Being able to dive deeper into visualizations and data was a great learning opportunity to clearly communicate relationships of data points, improving my understanding of data, and telling a story with data dashboards.


